Breakoutwatch Weekly Summary 09/08/18
You are receiving this email because you are or were a BreakoutWatch.com subscriber, or have subscribed to our weekly newsletter. This newsletter summarizes the breakout events of the week and provides additional guidance that does not fit into our daily format. It is published each weekend.
| NASDAQ Could Test Support Next Week
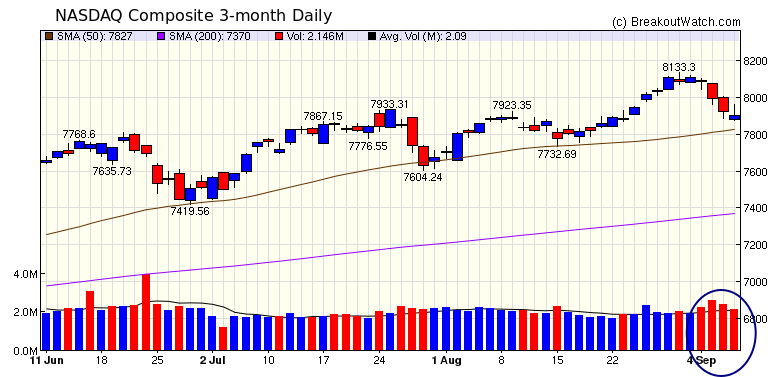
After Heavy Selling Volume As the week began, investors looked at the new highs set in the previous week and wondered how long this could continue. They looked at the NASDAQ with a particularly jaundiced aye and sold off the technology sector giving the index a loss of 2.6%. The DJI and S&P 500 gave up 0.2% and 1.0% respectively. The chart shows that volumes for the NASDAQ were above the 50 day average and it appears that support at the 50 day average will be tested next week. Despite the negative week, our trend indicators remain positive. Friday's employment report showed wages are starting to increase which ignited fears that inflation could increase. It is virtually certain that there will be a further increase in the Fed funds rate this month. The downtrend produced fewer breakouts this week. The best performer was VRA (Vera Bradley) which gapped up 9% above its breakout price on Wednesday following an earnings report that beat expectations. There was little in the stock chart to suggest a strong breakout was coming, and as the gap up exceeded the suggested 5% limit it was difficult to jump on to.  |
| No new features this week |
|
Our latest strategy
suggestions are here.
|
| List | Breakouts | Avg. Gain |
|---|---|---|
| CWH | 4 | 4.16 |
| SQZ | 1 | 3.55 |
| HTF | 0 | |
| HSB | 0 | |
| DB | 2 | 4.51 |
| Brkout Date | Symbol | Base | Squeeze | BrkoutOut Price | Brkout Day Close | RS Rank* | Last Close | Current % off BOP | Gain at Intraday High |
|---|---|---|---|---|---|---|---|---|---|
| 2018-09-05 | VRA | CWH | n | 14.89 | 16.4 | 92 | 16.77 | 12.63% | 12.49% |
| 2018-09-05 | ULTA | DB | n | 253.95 | 274.93 | 78 | 285.8 | 12.54% | 8.82% |
| 2018-09-07 | EAT | SQZ | y | 45.87 | 47.5 | 82 | 47.5 | 3.55% | -0.92% |
| 2018-09-03 | HSKA | DB | n | 102.87 | 47.5 | 78 | 105.02 | 2.09% | 0.2% |
| 2018-09-06 | TIER | CWH | n | 23.82 | 24.49 | 81 | 24.3 | 2.02% | 1.68% |
| 2018-09-07 | FLDM | CWH | n | 7.92 | 8.03 | 91 | 8.03 | 1.39% | -4.17% |
| 2018-09-07 | PTC | CWH | n | 98.31 | 98.9 | 90 | 98.9 | 0.6% | -1.33% |
| *RS Rank on day before breakout. | |||||||||
| Symbol | BO Price |
BO Vol. |
Company | Industry | RS Rank |
Last Close |
|---|---|---|---|---|---|---|
| FLOW | 48.79 | 294,435 | SPX FLOW - Inc. Common Stock | Diversified Machinery | 99 | 47.20 |
| XPO | 106.22 | 1,786,416 | XPO Logistics - Inc. | Air Delivery & Freight Services | 98 | 106.18 |
| These stocks meet our suggested screening factors
for our Cup and Handle Chart Pattern watchlist. See Revised Rules for Trading Cup and Handle Breakouts |
||||||
| Index | Value | Change Week | Change YTD | Trend1 |
|---|---|---|---|---|
| Dow | 25916.5 |
-0.19% | 4.84% | Up |
| NASDAQ | 7902.54 |
-2.55% | 14.47% | Up |
| S&P 500 | 2871.68 |
-1.03% | 7.41% | Up |
|
1The Market Trend is derived from
our proprietary market model. The market model is described on
the site here.
2The site also shows industry rankings based on fundamentals, combined technical and fundamentals, and on price alone. The site also shows daily industry movements. |
||||
| 1 Week | 13 Weeks | 26 Weeks | Year-to-Date |
|---|---|---|---|
| Dow Jones |
NASDAQ Composite 3.36 % |
NASDAQ Composite 4.52 % |
NASDAQ Composite 14.47 % |
| 1 Week | 3 Weeks | 13 Weeks | 26 Weeks |
|---|---|---|---|
| Internet Service Providers |
Internet Service Providers |
Auto Parts Stores |
Home Health Care |
| Gas Utilities 70 |
Manufactured Housing 207 |
Toy & Hobby Stores 189 |
REIT - Healthcare Facilities 190 |
| Charts of each industry rank and performance over 12 months are available on the site | |||
If you received this newsletter from a friend and you would like to receive it regularly please go to the BreakoutWatch.com site and you will then be able to register to receive the newsletter.
Copyright (c) 09/09/2018 NBIcharts, LLC dba BreakoutWatch.com. All
rights reserved.
" BreakoutWatch," the BreakoutWatch.com "eye" logo, and the slogan
"tomorrow's breakouts today" are service marks of NBIcharts LLC. All
other marks are the property of their respective owners, and are used
for descriptive purposes only.
BreakoutWatch is not affiliated with Investor's Business Daily or with Mr. William O'Neil. Our site, research and analysis is supported entirely by subscription and is free from advertising.