Breakoutwatch Weekly Summary 09/22/18
You are receiving this email because you are or were a BreakoutWatch.com subscriber, or have subscribed to our weekly newsletter. This newsletter summarizes the breakout events of the week and provides additional guidance that does not fit into our daily format. It is published each weekend.
| NASDAQ Slips due to New Sector
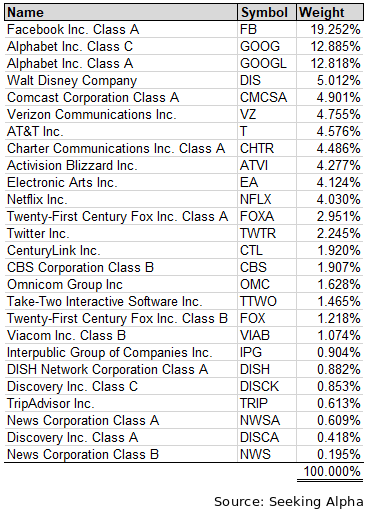
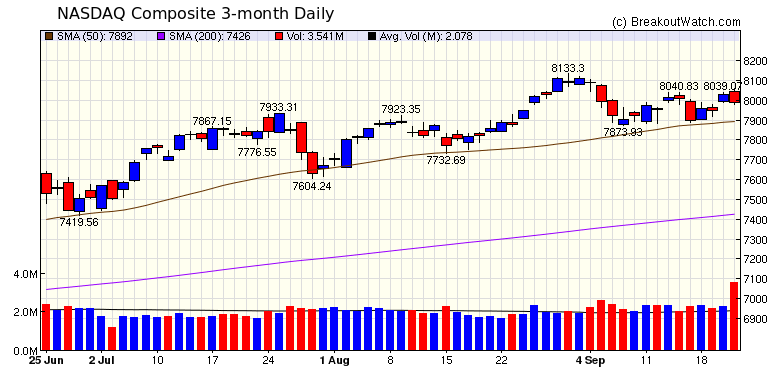
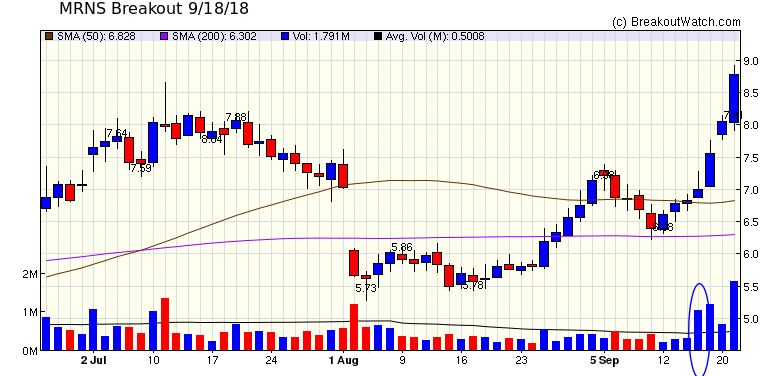
Creation A new sector 'Communications Services' was created following Friday's close resulting in significantly increased trading in NASDAQ stocks as portfolio managers re-balanced portfolios in anticipation of the new sector beginning operation on Monday. The change also coincided with a 'quadruple witching day' when volumes usually increase as futures and options contracts expire. Several large cap technology stocks (Twitter, Facebook and Alphabet) took a hit as they were re-classified into the new sector. The result was a loss for the week of the NASDAQ of 0.3% while the DJI and S&P 500 gained 2.3% and 0.9% respectively. The composition of the new sector is:   Top performing breakout stock for the week was MRNS which broke out from a cup and handle pattern on Monday. The stock showed volume well above average the day before breakout suggesting that a breakout was imminent.  |
| No new features this week |
|
Our latest strategy
suggestions are here.
|
| List | Breakouts | Avg. Gain |
|---|---|---|
| CWH | 8 | 3.74 |
| SQZ | 4 | 5.73 |
| HTF | 0 | |
| HSB | 0 | |
| DB | 2 | 4.59 |
| Brkout Date | Symbol | Base | Squeeze | BrkoutOut Price | Brkout Day Close | RS Rank* | Last Close | Current % off BOP | Gain at Intraday High |
|---|---|---|---|---|---|---|---|---|---|
| 2018-09-17 | MRNS | CWH | n | 6.98 | 7 | 81 | 8.78 | 25.79% | 13.32% |
| 2018-09-18 | EPM | SQZ | y | 10.26 | 10.8 | 89 | 11.2 | 9.16% | 4.78% |
| 2018-09-17 | RDNT | SQZ | y | 14.31 | 15.05 | 82 | 15.55 | 8.67% | 6.99% |
| 2018-09-18 | YELP | DB | n | 47.73 | 49.97 | 71 | 49.92 | 4.59% | 4.23% |
| 2018-09-20 | YELP | DB | n | 47.73 | 52.07 | 77 | 49.92 | 4.59% | 4.23% |
| 2018-09-19 | ZFGN | CWH | n | 10.46 | 11.17 | 98 | 10.78 | 3.06% | 3.25% |
| 2018-09-20 | MBI | SQZ | y | 10.95 | 11.26 | 86 | 11.24 | 2.65% | 2.37% |
| 2018-09-21 | CVI | SQZ | y | 38.28 | 39.21 | 82 | 39.21 | 2.43% | 0.18% |
| 2018-09-18 | CASY | CWH | n | 126.86 | 127.76 | 84 | 128.88 | 1.59% | 0.58% |
| 2018-09-21 | STML | CWH | n | 17.05 | 17.3 | 83 | 17.3 | 1.47% | -0.29% |
| 2018-09-21 | HCKT | CWH | n | 20.11 | 20.39 | 86 | 20.39 | 1.39% | -2.24% |
| 2018-09-20 | MNOV | CWH | n | 11.78 | 12.2 | 93 | 11.93 | 1.27% | 0.08% |
| 2018-09-21 | AZO | CWH | n | 768.42 | 769.87 | 82 | 769.87 | 0.19% | -1.03% |
| 2018-09-19 | FLDM | CWH | n | 8.26 | 8.29 | 95 | 7.86 | -4.84% | -1.21% |
| *RS Rank on day before breakout. | |||||||||
| Symbol | BO Price |
BO Vol. |
Company | Industry | RS Rank |
Last Close |
|---|---|---|---|---|---|---|
| NITE | 25.83 | 179,388 | Nightstar Therapeutics plc - American Depositary S | Investment Brokerage - Regional | 97 | 25.50 |
| NDLS | 12.55 | 780,543 | Noodles & Company - Common Stock | Restaurants | 97 | 12.50 |
| SKY | 30.10 | 526,884 | Skyline Champion Corporation Common Stock | Manufactured Housing | 96 | 30.03 |
| GPRK | 19.12 | 393,795 | Geopark Ltd Common Shares | Oil & Gas Drilling & Exploration | 95 | 19.00 |
| These stocks meet our suggested screening factors
for our Cup and Handle Chart Pattern watchlist. See Revised Rules for Trading Cup and Handle Breakouts |
||||||
| Index | Value | Change Week | Change YTD | Trend1 |
|---|---|---|---|---|
| Dow | 26743.5 |
2.25% | 8.19% | Up |
| NASDAQ | 7986.96 |
-0.29% | 15.7% | Up |
| S&P 500 | 2929.67 |
0.85% | 9.58% | Up |
|
1The Market Trend is derived from
our proprietary market model. The market model is described on
the site here.
2The site also shows industry rankings based on fundamentals, combined technical and fundamentals, and on price alone. The site also shows daily industry movements. |
||||
| 1 Week | 13 Weeks | 26 Weeks | Year-to-Date |
|---|---|---|---|
| Dow Jones |
Dow Jones 3.82 % |
NASDAQ Composite 14.22 % |
NASDAQ Composite 15.7 % |
| 1 Week | 3 Weeks | 13 Weeks | 26 Weeks |
|---|---|---|---|
| Internet Service Providers |
Internet Service Providers |
Auto Parts Stores |
Manufactured Housing |
| Housewares & Accessories 94 |
Cleaning Products 113 |
Toy & Hobby Stores 207 |
Grocery Stores 185 |
| Charts of each industry rank and performance over 12 months are available on the site | |||
If you received this newsletter from a friend and you would like to receive it regularly please go to the BreakoutWatch.com site and you will then be able to register to receive the newsletter.
Copyright (c) 09/22/2018 NBIcharts, LLC dba BreakoutWatch.com. All
rights reserved.
" BreakoutWatch," the BreakoutWatch.com "eye" logo, and the slogan
"tomorrow's breakouts today" are service marks of NBIcharts LLC. All
other marks are the property of their respective owners, and are used
for descriptive purposes only.
BreakoutWatch is not affiliated with Investor's Business Daily or with Mr. William O'Neil. Our site, research and analysis is supported entirely by subscription and is free from advertising.