Breakoutwatch Weekly Summary 01/12/19
You are receiving this email because you are or were a BreakoutWatch.com subscriber, or have subscribed to our weekly newsletter. This newsletter summarizes the breakout events of the week and provides additional guidance that does not fit into our daily format. It is published each weekend.
| Stronger Performance by Long
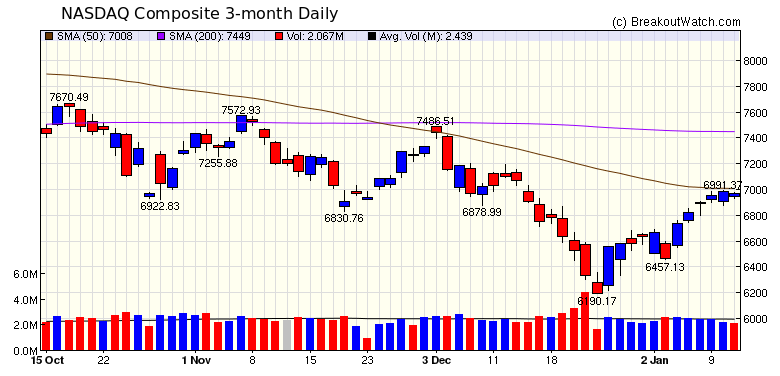
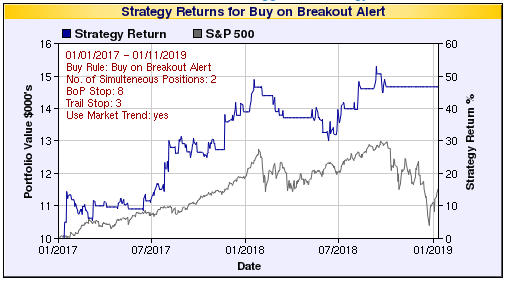
Position Breakouts The NASDAQ was the strongest of the three major indexes this week with a 3.4% gain. The gains came early in the week but plateaued in the last 3 days as volumes fell below average and closed with a small loss on Friday. The index looks ready to test resistance at the 200 day moving average but may be limited by uncertainty over the potential length of the Government shutdown. Investors will also be cautious as earnings season opens as forward earnings projections may indicate a slowing of the economy in 2019. A vote in the UK Parliament on Tuesday regarding Brexit may also impact market performance.  The week saw a rebound in long position breakouts with 17 meeting our confirmed breakout criteria and average gains over 2.5%. Our market trend signals remain negative, however. The purpose of the trend signals is to protect gains when the market turns down and to be conservative when the market recovers so that whipsawing is minimized. This is illustrated by results from our recommended buy on alert strategy backtest. the horizontal lines indicate times when no trades were recommended due to negative market signals. You can see that gains up to the beginning of the current correction were protected when the trend signals turned down.  |
No new features this week |
|
Our latest strategy
suggestions are here.
|
| List | Breakouts | Avg. Gain |
|---|---|---|
| CWH | 7 | 2.54 |
| SQZ | 7 | 2.93 |
| HTF | 0 | |
| HSB | 0 | |
| DB | 3 | 1.47 |
| Brkout Date | Symbol | Base | Squeeze | Brkout Price | Brkout Day Close | RS Rank* | Last Close | Current % off BOP | Gain at Intraday High |
|---|---|---|---|---|---|---|---|---|---|
| 2019-01-07 | WING | SQZ | y | 62.72 | 67.43 | 96 | 69.99 | 11.59% | 15.15% |
| 2019-01-07 | INSP | DB | n | 44.82 | 45.58 | 89 | 47.75 | 6.54% | 8.39% |
| 2019-01-07 | TEAM | CWH | y | 90.88 | 92.71 | 96 | 95.65 | 5.25% | 6.7% |
| 2019-01-09 | GLOB | SQZ | y | 57.40 | 60.83 | 89 | 60.25 | 4.97% | 8.68% |
| 2019-01-07 | LION | CWH | n | 26.84 | 27.83 | 92 | 27.99 | 4.28% | 6.71% |
| 2019-01-10 | LQDT | CWH | n | 7.69 | 7.73 | 96 | 7.99 | 3.9% | 4.81% |
| 2019-01-07 | FIVN | CWH | y | 44.79 | 45.89 | 96 | 46.38 | 3.55% | 7.43% |
| 2019-01-07 | BRG | SQZ | y | 9.90 | 9.92 | 91 | 10.2 | 3.03% | 5.05% |
| 2019-01-11 | SBS | CWH | n | 10.36 | 10.59 | 95 | 10.59 | 2.22% | 2.9% |
| 2019-01-08 | FIVN | SQZ | y | 45.90 | 46.94 | 97 | 46.38 | 1.05% | 4.84% |
| 2019-01-09 | RFIL | SQZ | y | 7.90 | 8.05 | 98 | 7.98 | 1.01% | 4.43% |
| 2019-01-08 | ASND | DB | n | 68.98 | 70.94 | 93 | 69.25 | 0.39% | 6.31% |
| 2019-01-08 | USG | CWH | y | 43.15 | 43.16 | 85 | 43.02 | -0.3% | 0.81% |
| 2019-01-10 | PRGX | SQZ | y | 9.16 | 9.21 | 83 | 9.11 | -0.55% | 2.13% |
| 2019-01-09 | EFC | SQZ | y | 15.69 | 15.71 | 87 | 15.6 | -0.57% | 0.96% |
| 2019-01-09 | LRN | CWH | n | 24.85 | 25.02 | 97 | 24.58 | -1.09% | 3.74% |
| 2019-01-09 | WRLD | DB | n | 111.73 | 111.88 | 88 | 108.9 | -2.53% | 3.5% |
| *RS Rank on day before breakout. | |||||||||
| Symbol | BO Price |
BO Vol. |
Company | Industry | RS Rank |
Last Close |
|---|---|---|---|---|---|---|
| These stocks meet our suggested screening factors
for our Cup and Handle Chart Pattern watchlist. See Revised Rules for Trading Cup and Handle Breakouts |
||||||
| Index | Value | Change Week | Change YTD | Trend1 |
|---|---|---|---|---|
| Dow | 23996 |
2.4% | 2.87% | Down |
| NASDAQ | 6971 |
3.44% | 5.06% | Down |
| S&P 500 | 2596 |
2.53% | 3.56% | Down |
|
1The Market Trend is derived from
our proprietary market model. The market model is described on
the site here.
2The site also shows industry rankings based on fundamentals, combined technical and fundamentals, and on price alone. The site also shows daily industry movements. |
||||
| 1 Week | 13 Weeks | 26 Weeks | Year-to-Date |
|---|---|---|---|
| NASDAQ Composite |
Dow Jones -5.3 % |
Dow Jones -4.09 % |
NASDAQ Composite 5.06 % |
| 1 Week | 3 Weeks | 13 Weeks | 26 Weeks |
|---|---|---|---|
| Foreign Utilities |
Foreign Utilities |
Foreign Utilities |
Auto Parts Stores |
| Drug Manufacturers - Other 68 |
Drug Manufacturers - Other 107 |
Computers Wholesale 163 |
Synthetics 214 |
| Charts of each industry rank and performance over 12 months are available on the site | |||
If you received this newsletter from a friend and you would like to receive it regularly please go to the BreakoutWatch.com site and you will then be able to register to receive the newsletter.
Copyright (c) 01/12/2019 NBIcharts, LLC dba BreakoutWatch.com. All
rights reserved.
" BreakoutWatch," the BreakoutWatch.com "eye" logo, and the slogan
"tomorrow's breakouts today" are service marks of NBIcharts LLC. All
other marks are the property of their respective owners, and are used
for descriptive purposes only.
BreakoutWatch is not affiliated with Investor's Business Daily or with Mr. William O'Neil. Our site, research and analysis is supported entirely by subscription and is free from advertising.