Breakoutwatch Weekly Summary 08/10/19
You are receiving this email because you are or were a BreakoutWatch.com subscriber, or have subscribed to our weekly newsletter. This newsletter summarizes the breakout events of the week and provides additional guidance that does not fit into our daily format. It is published each weekend.
| High Volatility Delivers Strong
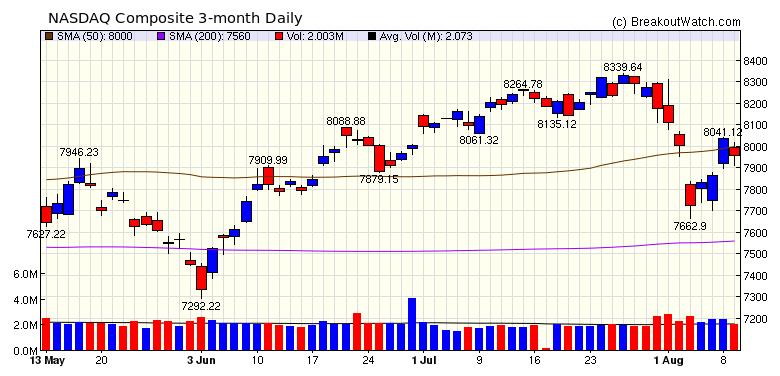
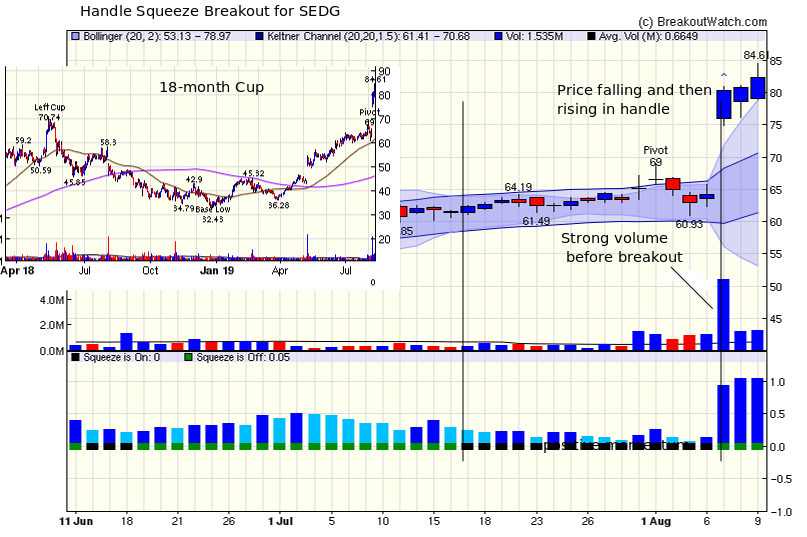
Breakouts but Trend is Down A volatile week, which initially gave the NASDAQ its biggest loss of the year on Monday, and turned our trend indicators negative, ended with the major indexes posting only modest losses. By Thursday's close, the NASDAQ had recovered its early losses but gave back 1% on Friday to close with a week-on-week loss of 0.6%. This left our trend indicators for the three major indexes still pointing down. These algorithms can be wrong, of course, but the trend is consistent with increasing indications that a recession may be on the horizon. Central banks at home and aboard are cutting interest rates to stimulate economies that they fear are flagging and the yield curve differential between 2 and 10 year treasuries fell to its lowest since 2007, which is widely considered a harbinger of recession. The volatility delivered some strong breakouts with 12 out of 18 coming from a volatility squeeze situation. 2 of these were from a volatility squeeze in the handle of a cup and handle pattern, and one, SEDG, delivered the highest gain of the week at 22.6%. See the analysis of SEDG below. My previous research (see Newsletter 4/10/15) showed that breakouts from a Cup and Handle Pattern with volatility squeeze provide best breakout day return and SEDG is a great example.  |
| No new features this week |
|
Our latest strategy
suggestions are here.
The breakout of SEDG came from a
short handle after an 18 month cup. The handle showed the
typical behavior we look for with falling price after setting
the pivot and then a rising right side of the handle. This was
accompanied by positive and rising momentum (a requirement for
it to be classified as a squeeze) and volume well above
average the day we put it on the watchlist.
 |
| List | Breakouts | Avg. Gain |
|---|---|---|
| CWH | 8 | 4.76 |
| SQZ | 10 | 4.47 |
| HTF | 0 | |
| HSB | 0 | |
| DB | 0 |
| Brkout Date | Symbol | Base | Squeeze | Brkout Price | Brkout Day Close | RS Rank* | Last Close | Current % off BOP | Gain at Intraday High |
|---|---|---|---|---|---|---|---|---|---|
| 2019-08-07 | SEDG | CWH | y | 69.00 | 80.3 | 97 | 82.33 | 19.32% | 22.61% |
| 2019-08-07 | FBM | SQZ | y | 16.96 | 17.7 | 97 | 18.72 | 10.38% | 16.4% |
| 2019-08-09 | UEIC | SQZ | y | 42.31 | 46.37 | 84 | 46.37 | 9.6% | 11.04% |
| 2019-08-09 | NVRO | CWH | n | 69.00 | 74.46 | 85 | 74.46 | 7.91% | 12.22% |
| 2019-08-08 | ECPG | CWH | n | 36.69 | 37.61 | 86 | 39.16 | 6.73% | 6.81% |
| 2019-08-08 | FBM | SQZ | y | 17.71 | 19.34 | 97 | 18.72 | 5.7% | 11.47% |
| 2019-08-07 | WTR | SQZ | y | 41.16 | 42.06 | 87 | 43.04 | 4.57% | 4.93% |
| 2019-08-08 | LXP | SQZ | y | 9.87 | 10.24 | 84 | 10.27 | 4.05% | 4.26% |
| 2019-08-07 | IRET | CWH | n | 64.95 | 65.03 | 85 | 67.48 | 3.9% | 7.01% |
| 2019-08-07 | SERV | SQZ | y | 54.83 | 55.37 | 93 | 56.97 | 3.9% | 5.45% |
| 2019-08-07 | OUT | SQZ | y | 27.04 | 27.12 | 93 | 27.86 | 3.03% | 4.47% |
| 2019-08-08 | WTR | SQZ | y | 42.07 | 42.47 | 88 | 43.04 | 2.31% | 2.66% |
| 2019-08-08 | REPH | CWH | n | 10.69 | 10.87 | 93 | 10.92 | 2.15% | 8.51% |
| 2019-08-09 | OHI | SQZ | y | 38.42 | 38.68 | 81 | 38.68 | 0.68% | 0.91% |
| 2019-08-09 | AEE | SQZ | y | 76.33 | 76.69 | 82 | 76.69 | 0.47% | 0.72% |
| 2019-08-09 | BMA | CWH | n | 76.22 | 76.48 | 96 | 76.48 | 0.34% | 1.43% |
| 2019-08-08 | USPH | CWH | y | 132.17 | 133.84 | 80 | 131.37 | -0.61% | 2.15% |
| 2019-08-05 | SA | CWH | n | 14.84 | 15.34 | 87 | 14.59 | -1.68% | 6.06% |
| *RS Rank on day before breakout. | |||||||||
| Symbol | BO Price |
BO Vol. |
Company | Industry | RS Rank |
Last Close |
|---|---|---|---|---|---|---|
| EBR | 11.16 | 500,318 | Centrais Eletricas Brasileiras S.A. - Eletrobras | Electric Utilities | 98 | 11.07 |
| CRMD | 9.99 | 614,852 | CorMedix - Inc. | Biotechnology | 96 | 8.20 |
| MAG | 12.36 | 581,193 | MAG Silver Corp. | Industrial Electrical Equipment | 95 | 11.99 |
| OMN | 10.04 | 1,282,404 | OMNOVA Solutions Inc. | Specialty Chemicals | 93 | 10.03 |
| ZNGA | 6.65 | 29,721,906 | Zynga Inc. | Multimedia & Graphics Software | 93 | 6.09 |
| EXTR | 8.50 | 1,863,969 | Extreme Networks - Inc. | Networking & Communication Devices | 91 | 8.10 |
| CSTM | 12.94 | 1,574,058 | Constellium SE | Metal Fabrication | 90 | 11.76 |
| SA | 15.74 | 712,470 | Seabridge Gold Inc. | Gold | 89 | 14.59 |
| VG | 13.73 | 4,939,412 | Vonage Holdings Corp. | Diversified Communication Services | 86 | 13.21 |
| AMKR | 9.79 | 1,344,856 | Amkor Technology - Inc. | Semiconductor - Integrated Circuits | 83 | 8.94 |
| These stocks meet our suggested screening factors
for our Cup and Handle Chart Pattern watchlist. See Revised Rules for Trading Cup and Handle Breakouts |
||||||
| Index | Value | Change Week | Change YTD | Trend1 |
|---|---|---|---|---|
| Dow | 26287.4 |
-0.75% | 12.69% | Down |
| NASDAQ | 7959.14 |
-0.56% | 19.95% | Down |
| S&P 500 | 2918.65 |
-0.46% | 16.43% | Down |
|
1The Market Trend is derived from
our proprietary market model. The market model is described on
the site here.
2The site also shows industry rankings based on fundamentals, combined technical and fundamentals, and on price alone. The site also shows daily industry movements. |
||||
| 1 Week | 13 Weeks | 26 Weeks | Year-to-Date |
|---|---|---|---|
| S&P 500 |
Dow Jones 0.53 % |
NASDAQ Composite 9.06 % |
NASDAQ Composite 19.95 % |
| 1 Week | 3 Weeks | 13 Weeks | 26 Weeks |
|---|---|---|---|
| Insurance Brokers |
Insurance Brokers |
Foreign Utilities |
Insurance Brokers |
| Personal Computers 71 |
Auto Parts Wholesale 80 |
Silver 191 |
Manufactured Housing 207 |
| Charts of each industry rank and performance over 12 months are available on the site | |||
If you received this newsletter from a friend and you would like to receive it regularly please go to the BreakoutWatch.com site and you will then be able to register to receive the newsletter.
Copyright (c) 08/10/2019 NBIcharts, LLC dba BreakoutWatch.com. All
rights reserved.
" BreakoutWatch," the BreakoutWatch.com "eye" logo, and the slogan
"tomorrow's breakouts today" are service marks of NBIcharts LLC. All
other marks are the property of their respective owners, and are used
for descriptive purposes only.
BreakoutWatch is not affiliated with Investor's Business Daily or with Mr. William O'Neil. Our site, research and analysis is supported entirely by subscription and is free from advertising.