Breakoutwatch Weekly Summary 12/21/19
You are receiving this email because you are or were a BreakoutWatch.com subscriber, or have subscribed to our weekly newsletter. This newsletter summarizes the breakout events of the week and provides additional guidance that does not fit into our daily format. It is published each weekend.
Thank
you to my subscribers for your support this year and I
wish you all a Merry Christmas and a Healthy and Happy New
Year
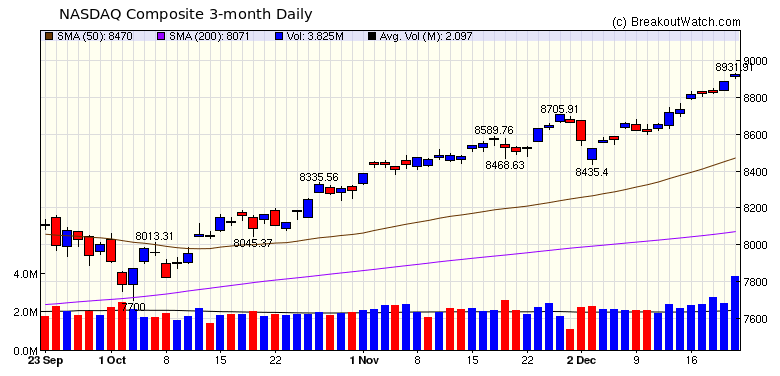
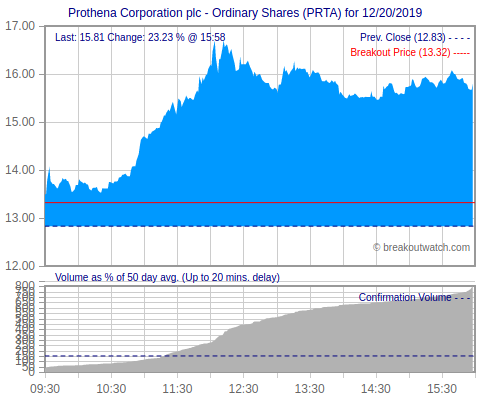
Markets Deliver a Christmas Bonus The major indexes surged to new highs again this week on well above average volume.The NASDAQ climbed 2.2% easily outperforming the S&P 500 (1.7%) and DJI (1.1%).  The higher volume produced an uptick in breakouts with the cup and handle pattern producing 10 with and average gain of 3.9% while the Volatility Squeeze pattern produced 7 with an average gain of 2.2%. Best performer was Prothena Corporation (PRTA) with a 23% one day gain over breakout price on a cup and handle breakout. The intraday chart (available on the Alerts page) shows how it could have been bought shortly after the open.  |
| No new features this week |
|
Our latest strategy
suggestions are here.
|
| List | Breakouts | Avg. Gain |
|---|---|---|
| CWH | 10 | 3.88 |
| SQZ | 7 | 2.21 |
| HTF | 0 | |
| HSB | 0 | |
| DB | 0 |
| Brkout Date | Symbol | Base | Squeeze | Brkout Price | Brkout Day Close | RS Rank* | Last Close | Current % off BOP | Gain at Intraday High |
|---|---|---|---|---|---|---|---|---|---|
| 2019-12-20 | PRTA | CWH | n | 13.32 | 15.85 | 89 | 15.85 | 18.99% | 25.79% |
| 2019-12-16 | TPTX | CWH | n | 57.60 | 58.74 | 86 | 63.25 | 9.81% | 11.93% |
| 2019-12-18 | NEO | CWH | n | 27.23 | 28.39 | 94 | 28.59 | 4.99% | 6.57% |
| 2019-12-17 | MGRC | SQZ | y | 74.43 | 75.03 | 83 | 77.6 | 4.26% | 5.35% |
| 2019-12-18 | CTAS | SQZ | y | 260.77 | 265.88 | 81 | 271.5 | 4.11% | 5.36% |
| 2019-12-18 | WYNN | CWH | n | 134.17 | 138.71 | 82 | 138.05 | 2.89% | 4.72% |
| 2019-12-20 | CCOI | SQZ | y | 63.98 | 65.32 | 84 | 65.32 | 2.09% | 2.16% |
| 2019-12-20 | GNTX | SQZ | y | 29.14 | 29.67 | 85 | 29.67 | 1.82% | 2.06% |
| 2019-12-20 | SHOO | SQZ | y | 42.89 | 43.53 | 90 | 43.53 | 1.49% | 1.66% |
| 2019-12-20 | NNBR | SQZ | y | 8.73 | 8.85 | 83 | 8.85 | 1.37% | 3.09% |
| 2019-12-20 | RGEN | CWH | n | 92.05 | 93.08 | 89 | 93.08 | 1.12% | 1.17% |
| 2019-12-19 | SBLK | CWH | y | 11.31 | 11.55 | 86 | 11.39 | 0.71% | 2.48% |
| 2019-12-16 | ONCE | CWH | n | 112.89 | 113.57 | 95 | 113.57 | 0.6% | 0.89% |
| 2019-12-17 | ZGNX | CWH | n | 51.85 | 52.78 | 81 | 52.06 | 0.41% | 3.12% |
| 2019-12-20 | EQIX | SQZ | y | 575.93 | 577.71 | 82 | 577.71 | 0.31% | 1.09% |
| 2019-12-19 | VRTS | CWH | n | 123.26 | 123.46 | 80 | 122.89 | -0.3% | 0.51% |
| 2019-12-19 | SGH | CWH | n | 36.15 | 36.54 | 90 | 36 | -0.41% | 4.4% |
| *RS Rank on day before breakout. | |||||||||
| Symbol | BO Price |
BO Vol. |
Company | Industry | RS Rank |
Last Close |
|---|---|---|---|---|---|---|
| GPRE | 16.49 | 878,283 | Green Plains - Inc. | Specialty Chemicals | 88 | 15.52 |
| LOCO | 16.65 | 636,754 | El Pollo Loco Holdings - Inc. | Restaurants | 85 | 15.17 |
| SONO | 15.68 | 2,477,960 | Sonos - Inc. | Consumer Electronics | 83 | 14.83 |
| SSRM | 17.25 | 1,388,072 | SSR Mining Inc. | Gold | 81 | 16.56 |
| These stocks meet our suggested screening factors
for our Cup and Handle Chart Pattern watchlist. See Revised Rules for Trading Cup and Handle Breakouts |
||||||
| Index | Value | Change Week | Change YTD | Trend1 |
|---|---|---|---|---|
| Dow | 28455.1 |
1.14% | 21.98% | Up |
| NASDAQ | 8924.96 |
2.18% | 34.51% | Up |
| S&P 500 | 3221.22 |
1.65% | 28.5% | Up |
|
1The Market Trend is derived from
our proprietary market model. The market model is described on
the site here.
2The site also shows industry rankings based on fundamentals, combined technical and fundamentals, and on price alone. The site also shows daily industry movements. |
||||
| 1 Week | 13 Weeks | 26 Weeks | Year-to-Date |
|---|---|---|---|
| NASDAQ Composite 2.18 % |
NASDAQ Composite 9.94 % |
NASDAQ Composite 11.12 % |
NASDAQ Composite 34.51 % |
| 1 Week | 3 Weeks | 13 Weeks | 26 Weeks |
|---|---|---|---|
| Semiconductor Equipment &
Materials |
Electric Utilities |
Electric Utilities |
Auto Dealerships |
| Information & Delivery Services 55 |
Security Software & Services 70 |
Electronics Stores 186 |
Home Furnishing Stores 190 |
| Charts of each industry rank and performance over 12 months are available on the site | |||
If you received this newsletter from a friend and you would like to receive it regularly please go to the BreakoutWatch.com site and you will then be able to register to receive the newsletter.
Copyright (c) 12/21/2019 NBIcharts, LLC dba BreakoutWatch.com. All
rights reserved.
" BreakoutWatch," the BreakoutWatch.com "eye" logo, and the slogan
"tomorrow's breakouts today" are service marks of NBIcharts LLC. All
other marks are the property of their respective owners, and are used
for descriptive purposes only.
BreakoutWatch is not affiliated with Investor's Business Daily or with Mr. William O'Neil. Our site, research and analysis is supported entirely by subscription and is free from advertising.