Breakoutwatch Weekly Summary 02/29/20
You are receiving this email because you are or were a BreakoutWatch.com subscriber, or have subscribed to our weekly newsletter. This newsletter summarizes the breakout events of the week and provides additional guidance that does not fit into our daily format. It is published each weekend.
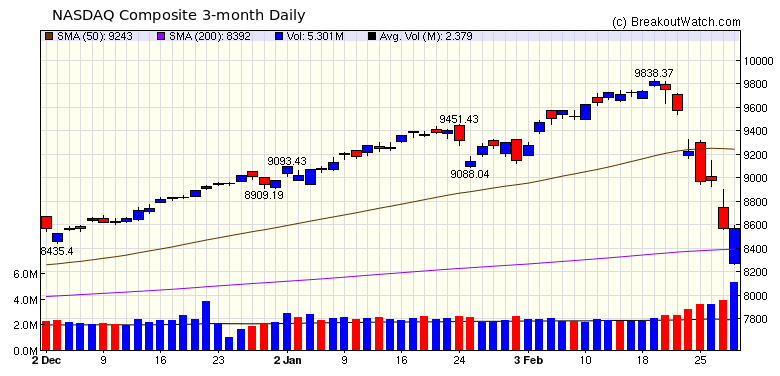
| How to Recognize a Market Bottom (See strategy Suggestions) The NASDAQ Comp gave up 10.5% this week but fared better than the two other major indexes. The index is 12.8% below its high putting it squarely in correction territory. The index was helped by a late rally on Friday that left the index with a slight gain on the day of 0.1%, after finding support at the 200 day moving average. The index may have been helped by comments from Apple CEO Tim Cook who said his company was working towards resuming full production in China. Starbucks also is reopening stores in China. If China does start to return to higher production levels, then fears of supply chain interruptions may decline and the markets could begin to recover. On the downside however, as the disease spreads in the US, consumer spending, which represents 70% of GDP, will inevitably fall.  While Larry Kudlow exhorts
investors to buy the dip, that strategy may have worked for the
NASDAQ on Friday, it did not work for the DOW or S&P 500,
where each rally was met with more selling. Friday's rally on
the NASDAQ should be treated with caution as more US coronavirus
cases will likely be discovered over the weekend.
|
If the the downward
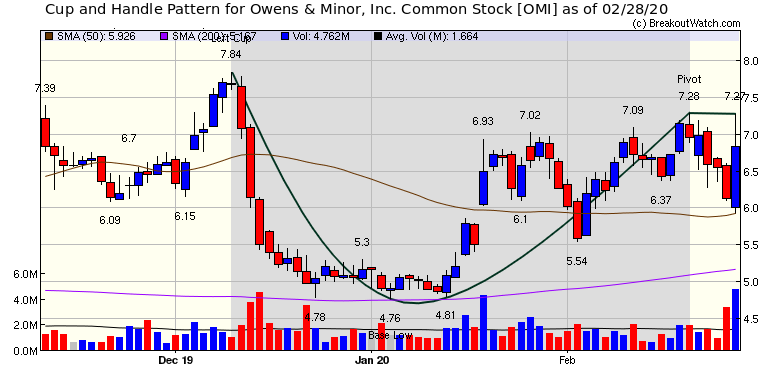
trend continues, there will be few breakouts to the upside. One
possibility from the Cup and Handle Pattern watchlist is Owens
and Minor (OMI) which moved up strongly on Friday. If an alert
is issued on Monday, then this may be a buy. |
| No new features this week |
|
How to Recognize a
Market Bottom
Readers familiar with CAN SLIM
will be aware of William O'Neil's concept of a "Follow-through-day".
In 2011, I analyzed the effectiveness of the strategy as
applied to the market bottom of March 9, 2009. You can see the
analysis here.
My conclusion was that although the concept correctly picked
the bottom for March 9, it was not always reliable in
subsequent corrections.
Consequently, I set about
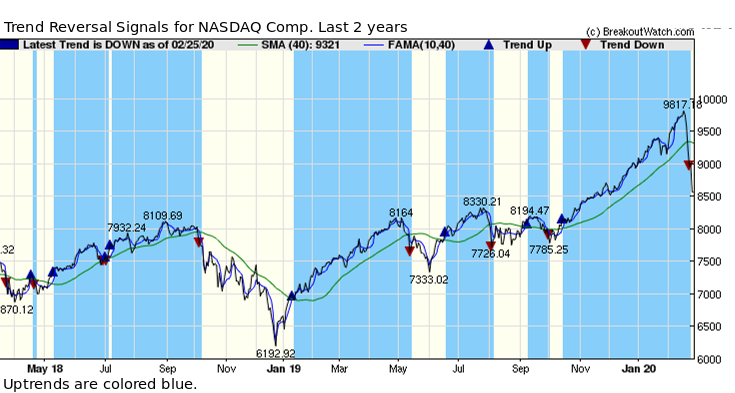
developing my own methodology which I call Trend Reversal
Signals which you can access from the Analytical Tools menu.
The tool can be used on any stock or index (IXIC,SPX,DJI). For
the NASDAQ over the last 2 years the tool gives the following
result. You will notice, that as with the follow-through
concept, there is a delay in recognizing the change in trend
as a few days must be allowed for the trend to be confirmed.
Note that the tool recognized the
current reversal on 02/25, the 4th day of reversal.
 |
| List | Breakouts | Avg. Gain |
|---|---|---|
| CWH | 1 | 2.31 |
| SQZ | 2 | 14.66 |
| HTF | 0 | |
| HSB | 0 | |
| DB | 0 |
| Brkout Date | Symbol | Base | Squeeze | Brkout Price | Brkout Day Close | RS Rank* | Last Close | Current % off BOP | Gain at Intraday High |
|---|---|---|---|---|---|---|---|---|---|
| 2020-02-24 | XAIR | SQZ | y | 6.49 | 7.33 | 93 | 8.28 | 27.58% | 34.67% |
| 2020-02-24 | LEU | CWH | y | 7.80 | 8.47 | 97 | 7.98 | 2.31% | 15.38% |
| 2020-02-28 | NTRA | SQZ | y | 37.26 | 37.91 | 95 | 37.905 | 1.73% | 1.77% |
| *RS Rank on day before breakout. | |||||||||
| Date | Symbol | List | Support | Close | Gain % |
|---|---|---|---|---|---|
| 02/25/2020 | KALA | HST | 6.27 | 6.12 | 2.39 % |
| 02/24/2020 | LPLA | SS | 94.59 | 87.57 | 7.42 % |
| 02/24/2020 | ZS | SS | 54.49 | 51.86 | 4.83 % |
| 02/24/2020 | NWL | SS | 19.56 | 17.9871 | 8.04 % |
| 02/25/2020 | EL | SS | 207.23 | 190.945 | 7.86 % |
| 02/25/2020 | T | SS | 38.26 | 37.35 | 2.38 % |
| 02/25/2020 | HEI | SS | 122.42 | 113.34 | 7.42 % |
| 02/25/2020 | EXAS | SS | 94.42 | 86.54 | 8.35 % |
| 02/25/2020 | KTOS | SS | 19.16 | 15 | 21.71 % |
| 02/25/2020 | WWD | SS | 120.02 | 112.99 | 5.86 % |
| 02/25/2020 | CY | SS | 23.39 | 23.13 | 1.11 % |
| 02/25/2020 | ABR | SS | 14.63 | 13.5174 | 7.6 % |
| 02/25/2020 | NOC | SS | 364.26 | 339.97 | 6.67 % |
| 02/26/2020 | CHS | SS | 4.07 | 3.91 | 3.93 % |
| 02/26/2020 | BLMN | SS | 21.69 | 19.19 | 11.53 % |
| 02/27/2020 | SSRM | SS | 18.00 | 17.16 | 4.67 % |
| 02/27/2020 | AU | SS | 20.69 | 19.42 | 6.14 % |
| 02/27/2020 | IAG | SS | 3.24 | 2.99 | 7.72 % |
| 02/27/2020 | CHS | SS | 4.07 | 3.65 | 10.32 % |
| 02/27/2020 | AXU | SS | 1.94 | 1.66 | 14.43 % |
| 02/28/2020 | WPC | SS | 82.49 | 77.41 | 6.16 % |
| 02/28/2020 | TWTR | SS | 33.96 | 33.2 | 2.24 % |
| 02/28/2020 | SSRM | SS | 18.01 | 15.83 | 12.1 % |
| 02/28/2020 | NGD | SS | 0.89 | 0.8 | 10.11 % |
| 02/28/2020 | HSY | SS | 151.59 | 143.99 | 5.01 % |
| 02/28/2020 | EQR | SS | 82.40 | 75.1 | 8.86 % |
| 02/28/2020 | CORT | SS | 12.91 | 12.62 | 2.25 % |
| 02/28/2020 | CDAY | SS | 70.85 | 70.73 | 0.17 % |
| Symbol | BO Price |
BO Vol. |
Company | Industry | RS Rank |
Last Close |
|---|---|---|---|---|---|---|
| IOTS | 12.39 | 1,586,916 | Adesto Technologies Corporation - Common Stock | Semiconductors | 96 | 12.26 |
| SILV | 8.30 | 1,021,394 | SilverCrest Metals Inc. Common Shares | Other Industrial Metals & Mining | 94 | 6.37 |
| UNIT | 11.05 | 5,538,759 | Uniti Group Inc. - Common Stock | REIT - Industrial | 92 | 9.76 |
| ELF | 20.00 | 1,211,601 | e.l.f. Beauty - Inc. Common Stock | Household & Personal Products | 91 | 15.96 |
| PRMW | 15.50 | 1,851,264 | Primo Water Corporation - Common Stock | Beverages - Non-Alcoholic | 90 | 14.00 |
| COOP | 14.68 | 727,674 | Mr. Cooper Group Inc. - Common Stock | Mortgage Finance | 88 | 12.83 |
| RESI | 12.86 | 849,690 | Front Yard Residential Corporation Common Stock | REIT - Residential | 87 | 12.68 |
| GILT | 10.76 | 835,506 | Gilat Satellite Networks Ltd. - Ordinary Shares | Communication Equipment | 84 | 9.41 |
| These stocks meet our suggested screening factors
for our Cup and Handle Chart Pattern watchlist. See Revised Rules for Trading Cup and Handle Breakouts |
||||||
| Index | Value | Change Week | Change YTD | Trend1 |
|---|---|---|---|---|
| Dow | 25409.4 |
-12.36% | -10.96% | Down |
| NASDAQ | 8567.37 |
-10.54% | -4.52% | Down |
| S&P 500 | 2954.22 |
-11.49% | -8.56% | Down |
|
1The Market Trend is derived from
our proprietary market model. The market model is described on
the site here.
2The site also shows industry rankings based on fundamentals, combined technical and fundamentals, and on price alone. The site also shows daily industry movements. |
||||
| 1 Week | 13 Weeks | 26 Weeks | Year-to-Date |
|---|---|---|---|
| NASDAQ Composite |
NASDAQ Composite -1.13 |
NASDAQ Composite 7.59 |
NASDAQ Composite -4.52 |
| 1 Week | 3 Weeks | 13 Weeks | 26 Weeks |
|---|---|---|---|
| Utilities - Renewable |
| Electrical Equipment & Parts 45 |
Solar 69 |
Financial Conglomerates 165 |
Closed-End Fund - Debt 195 |
| Charts of each industry rank and performance over 12 months are available on the site | |||
If you received this newsletter from a friend and you would like to receive it regularly please go to the BreakoutWatch.com site and you will then be able to register to receive the newsletter.
Copyright (c) 02/29/2020 NBIcharts, LLC dba BreakoutWatch.com. All
rights reserved.
" BreakoutWatch," the BreakoutWatch.com "eye" logo, and the slogan
"tomorrow's breakouts today" are service marks of NBIcharts LLC. All
other marks are the property of their respective owners, and are used
for descriptive purposes only.
BreakoutWatch is not affiliated with Investor's Business Daily or with Mr. William O'Neil. Our site, research and analysis is supported entirely by subscription and is free from advertising.