Breakoutwatch Weekly Summary 06/27/20
You are receiving this email because you are or were a
BreakoutWatch.com subscriber, or have subscribed to our weekly
newsletter. This newsletter summarizes the breakout events of the week
and provides additional guidance that does not fit into our daily
format. It is published each weekend.
Newsletter Archive: https://www.breakoutwatch.com/content/newsletters
| Tutorial: Using Intraday Chart to
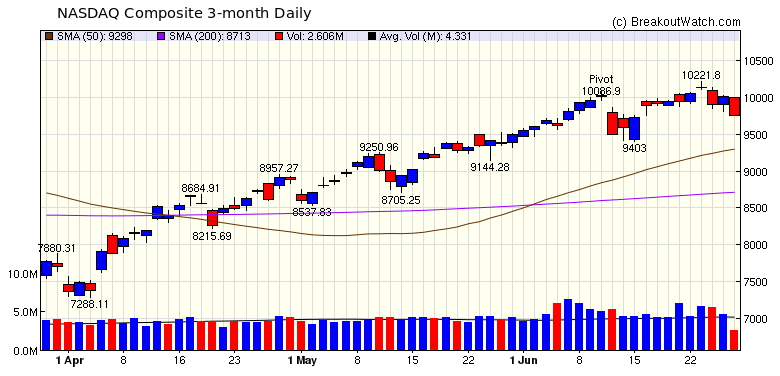
Buy After Alert Issued The NASDAQ composite slipped 2% this week, but still outperformed the two other major indexes. The week started well but evidence that the corona virus' accelerating spread threatened the economic recovery forced traders and investors to reassess the speed with which the economy, and therefore earnings, would recover. The drop in the NASDAQ ended an 8 session winning streak and further decline seems likely. Although our market trend signal is positive, it is a lagging indicator, and I would not be surprised to see it turn negative early next week. In that case the number of breakouts to the upside will decline. The evidence for this can already be seen in the number of breakouts this week where 16 of the 21 came in the first 3 days of the week.  |
| This week I'll show
how an intraday chart from our real-time alerts page can help
you make a buy decision when an alert is issued. Intraday charts
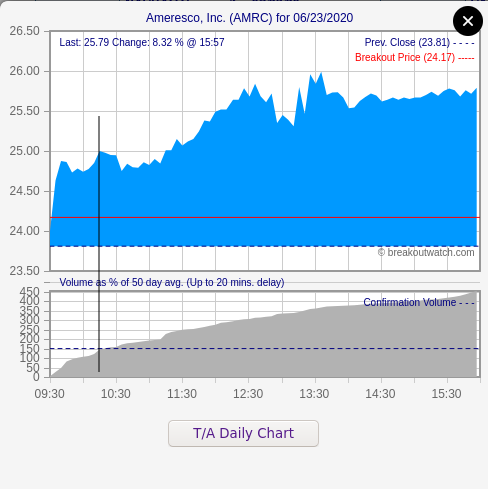
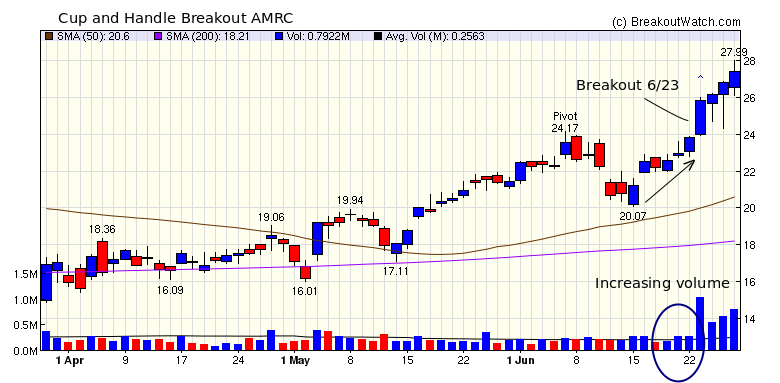
are obtained by clicking on the stock symbol on the alerts page. An alert was issued for AMRC on June 23 at 09:26. The image below was obtained after the market closed, but watching the chart in real time would have shown that the breakout volume was reached just after 10 am at a price of $25. AMRC closed on Friday at 27.4, a gain of 9.5%. That AMRC was a likely breakout candidate could have been seen from our cup and handle watchlist on 6/22 (see chart below) as the handle showed good appreciation on increasing volume.   |
| No new features this week |
|
Our latest strategy
suggestions are here.
|
| List | Breakouts | Avg. Gain |
|---|---|---|
| CWH | 7 | 1.2 |
| SQZ | 14 | 3.17 |
| HTF | 0 | |
| HSB | 0 | |
| DB | 0 |
| Brkout Date | Symbol | Base | Squeeze | Brkout Price | Brkout Day Close | RS Rank* | Last Close | Current % off BOP | Gain at Intraday High |
|---|---|---|---|---|---|---|---|---|---|
| 2020-06-23 | CLGX | SQZ | y | 51.80 | 53.06 | 83 | 67.95 | 31.18% | 32.05% |
| 2020-06-23 | PROF | SQZ | y | 13.46 | 15.2 | 89 | 16.08 | 19.47% | 20.73% |
| 2020-06-23 | AMRC | CWH | y | 24.17 | 25.81 | 86 | 27.38 | 13.28% | 15.8% |
| 2020-06-25 | OOMA | SQZ | y | 13.91 | 15.08 | 80 | 15.66 | 12.58% | 14.88% |
| 2020-06-26 | PROF | CWH | n | 15.38 | 16.08 | 89 | 16.08 | 4.55% | 5.66% |
| 2020-06-22 | CRSP | CWH | n | 71.00 | 72.02 | 86 | 74.04 | 4.28% | 12.56% |
| 2020-06-23 | KRTX | SQZ | y | 104.05 | 105.74 | 97 | 108.39 | 4.17% | 18.91% |
| 2020-06-26 | OOMA | SQZ | y | 15.09 | 15.66 | 86 | 15.66 | 3.78% | 5.9% |
| 2020-06-26 | RNG | SQZ | y | 279.49 | 289.29 | 94 | 289.29 | 3.51% | 6.05% |
| 2020-06-22 | IOTS | SQZ | y | 12.12 | 12.54 | 85 | 12.54 | 3.47% | 3.55% |
| 2020-06-26 | BILL | CWH | n | 88.75 | 89.74 | 95 | 89.74 | 1.12% | 1.34% |
| 2020-06-22 | CORT | CWH | n | 16.72 | 18.26 | 82 | 16.65 | -0.42% | 10.77% |
| 2020-06-23 | JOUT | CWH | n | 86.68 | 88.41 | 81 | 86.14 | -0.62% | 3.59% |
| 2020-06-23 | CSBR | SQZ | y | 9.14 | 9.37 | 85 | 8.98 | -1.75% | 9.08% |
| 2020-06-22 | XLRN | SQZ | y | 101.39 | 104.8 | 94 | 97.86 | -3.48% | 8.98% |
| 2020-06-24 | AHPI | SQZ | y | 11.79 | 13.32 | 97 | 11.26 | -4.5% | 26.12% |
| 2020-06-22 | DMTK | SQZ | y | 15.27 | 15.38 | 83 | 14.58 | -4.52% | 9.98% |
| 2020-06-23 | FLGT | SQZ | y | 17.20 | 17.5 | 94 | 16.19 | -5.87% | 4.59% |
| 2020-06-23 | XLRN | SQZ | y | 104.81 | 108.55 | 94 | 97.86 | -6.63% | 5.42% |
| 2020-06-22 | AHCO | SQZ | y | 18.12 | 22.08 | 90 | 16.85 | -7.01% | 24.56% |
| 2020-06-23 | EDIT | CWH | n | 33.55 | 34.34 | 84 | 28.92 | -13.8% | 9.63% |
| *RS Rank on day before breakout. | |||||||||
| Symbol | BO Price |
BO Vol. |
Company | Industry | RS Rank |
Last Close |
|---|---|---|---|---|---|---|
| BLDP | 14.63 | 3,263,163 | Ballard Power Systems - Inc. | Specialty Industrial Machinery | 97 | 13.65 |
| AKBA | 12.84 | 2,683,384 | Akebia Therapeutics - Inc. | Biotechnology | 96 | 11.68 |
| CBB | 14.98 | 1,177,736 | Cinci | Telecom Services | 94 | 14.85 |
| AUPH | 18.72 | 1,710,496 | Aurinia Pharmaceuticals Inc | Biotechnology | 92 | 15.49 |
| OMI | 9.14 | 3,062,505 | Owens & Minor - Inc. | Medical Distribution | 91 | 7.22 |
| TEVA | 13.23 | 16,836,112 | Teva Pharmaceutical Indus | Drug Manufacturers - Specialty & Generic | 90 | 12.19 |
| MEET | 6.25 | 2,251,545 | The Meet Group - Inc. | Internet Content & Information | 88 | 6.21 |
| IOTS | 12.55 | 853,260 | Adesto Technologies Corporation | Semiconductors | 86 | 12.54 |
| EGO | 9.44 | 4,150,802 | Eldorado Gold Corporation | Gold | 85 | 9.28 |
| BITA | 15.95 | 938,937 | Bitauto Holdings Limited | Advertising Agencies | 84 | 15.81 |
| These stocks meet our suggested screening factors
for our Cup and Handle Chart Pattern watchlist. See Revised Rules for Trading Cup and Handle Breakouts |
||||||
| Index | Value | Change Week | Change YTD | Trend1 |
|---|---|---|---|---|
| Dow | 25015.6 |
-3.31% | -12.34% | Up |
| NASDAQ | 9757.22 |
-1.9% | 8.74% | Up |
| S&P 500 | 3009.05 |
-2.86% | -6.86% | Up |
|
1The Market Trend is derived from
our proprietary market model. The market model is described on
the site here.
2The site also shows industry rankings based on fundamentals, combined technical and fundamentals, and on price alone. The site also shows daily industry movements. |
||||
| 1 Week | 13 Weeks | 26 Weeks | Year-to-Date |
|---|---|---|---|
| NASDAQ Composite |
NASDAQ Composite 30.05 |
NASDAQ Composite 8.33 |
NASDAQ Composite 8.74 |
| 1 Week | 3 Weeks | 13 Weeks | 26 Weeks |
|---|---|---|---|
| Silver |
Grocery Stores |
| Other Precious Metals & Mining 51 |
Tobacco 48 |
Copper 108 |
Gold 197 |
| Charts of each industry rank and performance over 12 months are available on the site | |||
If you received this newsletter from a friend and you would like to receive it regularly please go to the BreakoutWatch.com site and you will then be able to register to receive the newsletter.
Copyright (c) 06/27/2020 NBIcharts, LLC dba BreakoutWatch.com. All
rights reserved.
" BreakoutWatch," the BreakoutWatch.com "eye" logo, and the slogan
"tomorrow's breakouts today" are service marks of NBIcharts LLC. All
other marks are the property of their respective owners, and are used
for descriptive purposes only.
BreakoutWatch is not affiliated with Investor's Business Daily or with Mr. William O'Neil. Our site, research and analysis is supported entirely by subscription and is free from advertising.