Breakoutwatch Weekly Summary 08/08/20
You are receiving this email because you are or were a
BreakoutWatch.com subscriber, or have subscribed to our weekly
newsletter. This newsletter summarizes the breakout events of the week
and provides additional guidance that does not fit into our daily
format. It is published each weekend.
Newsletter Archive: https://www.breakoutwatch.com/content/newsletters
| Thirty One Breakouts This Week
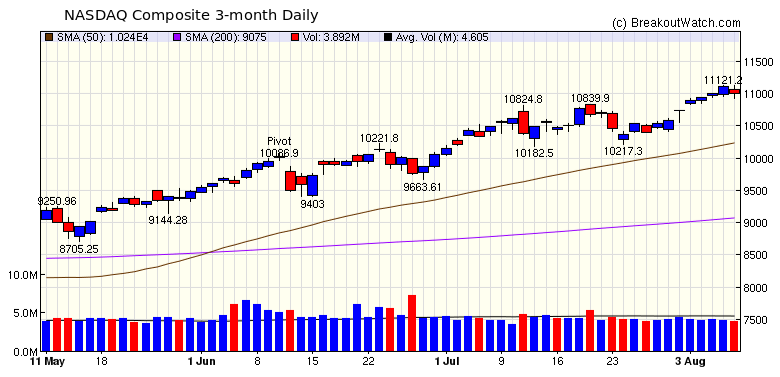
Average 5.8% Gain The NASDAQ Composite continued its rise with a 2.5% gain for the week and set another all-time high on Thursday before some profit taking on Friday. The NASDAQ was beaten this week by the DJI which rose 3.8% and closely followed by the S&P 500 (2.6%) indicating that the broader market is starting to believe that the economy is improving after the focus has been on tech stocks that have profited from the Covid lockdown.  The overall market condition since
the March bottom has seen an increase in stocks qualifying for
the High Tight Flag pattern (there are 10 on Friday's list).
This week saw 7 breakouts from that pattern with an average gain
of 10.2%. (see the breakout table below). The standout stock for
the week was EXPI which gained 37.2%.
Something to be aware of when
viewing the HTF watchlist is that some stocks will be takeover
candidates. These are recognizable as showing an almost flat
price pattern after qualifying for the HTF pattern.
|
The HTF pattern is
normally quite rare but as noted above the recent market action
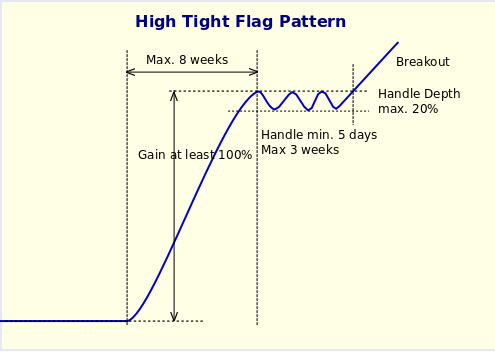
has produced a flurry of them. To qualify, a stock must gain at
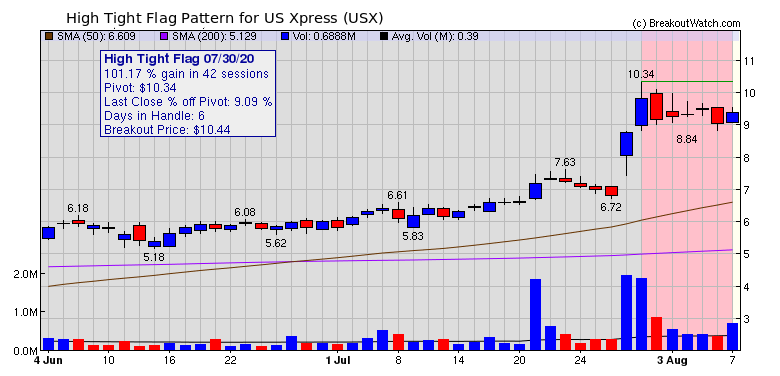
least 100% in a maximum of 8 weeks. USX ranks 3rd in the Trucking industry. Two high volume days at the end of July set up the completion of the pattern. Friday's volume was about twice the 50 day average which may be especially significant as volume as generally lower during the summer and especially on Friday's.  |
| No new features this week |
|
Our latest strategy
suggestions are here.
|
| List | Breakouts | Avg. Gain |
|---|---|---|
| CWH | 11 | 2.99 |
| SQZ | 13 | 5.94 |
| HTF | 7 | 10.15 |
| HSB | 0 | |
| DB | 0 |
| Brkout Date | Symbol | Base | Squeeze | Brkout Price | Brkout Day Close | RS Rank* | Last Close | Current % off BOP | Gain at Intraday High |
|---|---|---|---|---|---|---|---|---|---|
| 2020-08-04 | EXPI | HTF | n | 21.22 | 22.83 | 95 | 29.12 | 37.23% | 40.25% |
| 2020-08-05 | SGRY | CWH | n | 16.69 | 19.31 | 91 | 19.85 | 18.93% | 25.58% |
| 2020-08-04 | AHCO | SQZ | y | 19.75 | 20.42 | 81 | 23.29 | 17.92% | 28.51% |
| 2020-08-03 | GSX | HTF | n | 92.00 | 97.59 | 99 | 106.99 | 16.29% | 54.1% |
| 2020-08-03 | MIRM | SQZ | y | 22.09 | 22.49 | 93 | 25.28 | 14.44% | 20.04% |
| 2020-08-05 | AHCO | SQZ | y | 20.43 | 22.48 | 84 | 23.29 | 14% | 24.23% |
| 2020-08-03 | XPEL | CWH | n | 17.72 | 19.21 | 91 | 20.06 | 13.21% | 16.14% |
| 2020-08-07 | BGFV | HTF | n | 6.93 | 7.81 | 98 | 7.81 | 12.7% | 22.22% |
| 2020-08-06 | ASPU | SQZ | y | 9.90 | 10.47 | 89 | 11 | 11.11% | 11.72% |
| 2020-08-04 | EDUC | HTF | n | 14.65 | 15.04 | 97 | 15.99 | 9.15% | 34.88% |
| 2020-08-06 | WMS | CWH | y | 51.23 | 53.06 | 81 | 55.5 | 8.33% | 9.36% |
| 2020-08-06 | LCUT | SQZ | y | 8.05 | 8.09 | 82 | 8.62 | 7.08% | 8.2% |
| 2020-08-06 | PRSC | CWH | n | 83.91 | 86.55 | 85 | 89.83 | 7.06% | 8.65% |
| 2020-08-07 | TMUS | SQZ | y | 108.11 | 115.09 | 81 | 115.09 | 6.46% | 9.15% |
| 2020-08-07 | INFU | CWH | n | 13.09 | 13.87 | 90 | 13.87 | 5.96% | 8.4% |
| 2020-08-07 | SNDX | SQZ | y | 15.01 | 15.84 | 85 | 15.84 | 5.53% | 10.66% |
| 2020-08-05 | AEIS | SQZ | y | 74.93 | 77.47 | 81 | 78.64 | 4.95% | 6.43% |
| 2020-08-03 | NVMI | SQZ | y | 51.41 | 53.61 | 89 | 53.91 | 4.86% | 12.51% |
| 2020-08-03 | CHWY | SQZ | y | 52.50 | 56.84 | 91 | 54.91 | 4.59% | 12.95% |
| 2020-08-07 | SMED | CWH | n | 8.25 | 8.54 | 89 | 8.54 | 3.52% | 8.97% |
| 2020-08-04 | DQ | HTF | n | 119.26 | 124.22 | 97 | 122.55 | 2.76% | 7.77% |
| 2020-08-07 | BRP | CWH | n | 18.76 | 19.23 | 85 | 19.23 | 2.51% | 5.97% |
| 2020-08-06 | KSU | CWH | n | 184.16 | 185.42 | 81 | 187.04 | 1.56% | 6.14% |
| 2020-08-06 | PODD | SQZ | y | 215.33 | 220.42 | 81 | 217.73 | 1.11% | 8.55% |
| 2020-08-05 | HUYA | CWH | y | 26.44 | 27.06 | 85 | 26.66 | 0.83% | 7.68% |
| 2020-08-06 | SITM | HTF | n | 59.80 | 61.58 | 96 | 58.92 | -1.47% | 8.09% |
| 2020-08-03 | DAO | HTF | y | 45.89 | 46.01 | 97 | 43.3 | -5.64% | 3.94% |
| 2020-08-03 | HEBT | SQZ | y | 17.31 | 17.53 | 98 | 16.13 | -6.82% | 9.76% |
| 2020-08-04 | HEBT | SQZ | y | 17.54 | 18 | 98 | 16.13 | -8.04% | 8.32% |
| 2020-08-03 | INSG | CWH | n | 13.90 | 14.56 | 94 | 12.08 | -13.09% | 9.71% |
| 2020-08-03 | LMNX | CWH | n | 38.13 | 38.9 | 87 | 32.06 | -15.92% | 9.34% |
| *RS Rank on day before breakout. | |||||||||
| Symbol | BO Price |
BO Vol. |
Company | Industry | RS Rank |
Last Close |
|---|---|---|---|---|---|---|
| CBB | 15.10 | 815,661 | Cinci | Telecom Services | 95 | 15.08 |
| MESO | 16.40 | 696,340 | Mesoblast Limited | Biotechnology | 95 | 16.04 |
| INSG | 15.25 | 6,170,644 | Inseego Corp. | Communication Equipment | 93 | 12.08 |
| PSTI | 12.15 | 874,296 | Pluristem Therapeutics - Inc. | Biotechnology | 93 | 8.97 |
| VMD | 11.98 | 680,883 | Viemed Healthcare - Inc. | Medical Devices | 89 | 10.11 |
| CTSO | 11.74 | 854,403 | Cytosorbents Corporation | Medical Devices | 88 | 9.55 |
| RAD | 18.64 | 5,628,512 | Rite Aid Corporation | Pharmaceutical Retailers | 86 | 15.05 |
| AVID | 9.66 | 759,338 | Avid Technology - Inc. | Electronic Gaming & Multimedia | 82 | 8.94 |
| These stocks meet our suggested screening factors
for our Cup and Handle Chart Pattern watchlist. See Revised Rules for Trading Cup and Handle Breakouts |
||||||
| Index | Value | Change Week | Change YTD | Trend1 |
|---|---|---|---|---|
| Dow | 27433.5 |
3.8% | -3.87% | Up |
| NASDAQ | 11011 |
2.47% | 22.72% | Up |
| S&P 500 | 3351.28 |
2.45% | 3.73% | Up |
|
1The Market Trend is derived from
our proprietary market model. The market model is described on
the site here.
2The site also shows industry rankings based on fundamentals, combined technical and fundamentals, and on price alone. The site also shows daily industry movements. |
||||
| 1 Week | 13 Weeks | 26 Weeks | Year-to-Date |
|---|---|---|---|
| Dow Jones |
NASDAQ Composite 20.72 |
NASDAQ Composite 15.66 |
NASDAQ Composite 22.72 |
| 1 Week | 3 Weeks | 13 Weeks | 26 Weeks |
|---|---|---|---|
| Silver |
Silver |
Financial Data & Stock Exchanges |
| Furnishings, Fixtures & Appliances 22 |
Other Precious Metals & Mining 47 |
Residential Construction 101 |
Copper 136 |
| Charts of each industry rank and performance over 12 months are available on the site | |||
If you received this newsletter from a friend and you would like to receive it regularly please go to the BreakoutWatch.com site and you will then be able to register to receive the newsletter.
Copyright (c) 08/08/2020 NBIcharts, LLC dba BreakoutWatch.com. All
rights reserved.
" BreakoutWatch," the BreakoutWatch.com "eye" logo, and the slogan
"tomorrow's breakouts today" are service marks of NBIcharts LLC. All
other marks are the property of their respective owners, and are used
for descriptive purposes only.
BreakoutWatch is not affiliated with Investor's Business Daily or with Mr. William O'Neil. Our site, research and analysis is supported entirely by subscription and is free from advertising.