Breakoutwatch Weekly Summary 08/15/20
You are receiving this email because you are or were a
BreakoutWatch.com subscriber, or have subscribed to our weekly
newsletter. This newsletter summarizes the breakout events of the week
and provides additional guidance that does not fit into our daily
format. It is published each weekend.
Newsletter Archive: https://www.breakoutwatch.com/content/newsletters
| Why We Focus on the NASDAQ for
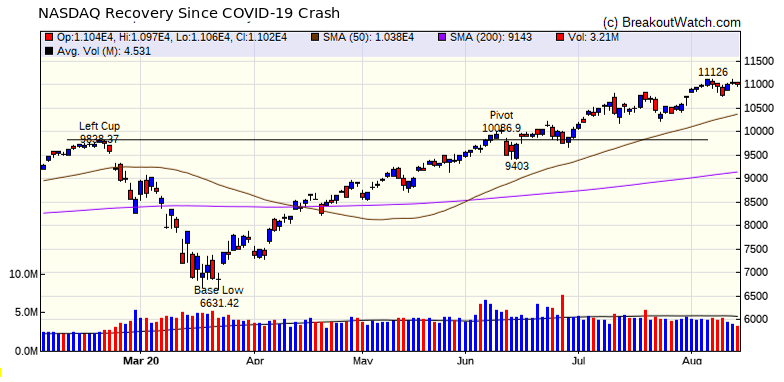
Potential Breakouts I get asked why do I show the NASDAQ chart each week? The simple answer is that that's where most breakouts come from. For example, since March 13, which was the bottom of the COVID-19 crash, 72% of all breakouts have come from the NASDAQ, 25% from the NYSE and 3% from the AMEX exchange. The stunning rise of the NASDAQ is evident in the chart since the beginning of the crash. It took only until June 10 to recover to its previous high and has gained a further 9% since then. The index was knocked of it's perch this week, though as the DJI gained 1.8% and the NASDAQ barely 1%. Analysts are starting warn that the rise in the tech sector may soon be moderated as investors rotate in cyclical stocks. The sectors that performed best were industrials (+3.1%), energy (+2.3%), consumer discretionary (+1.6%), materials (+1.5%), and financials (+1.3%). Source (briefing.com).  |
In my view, the
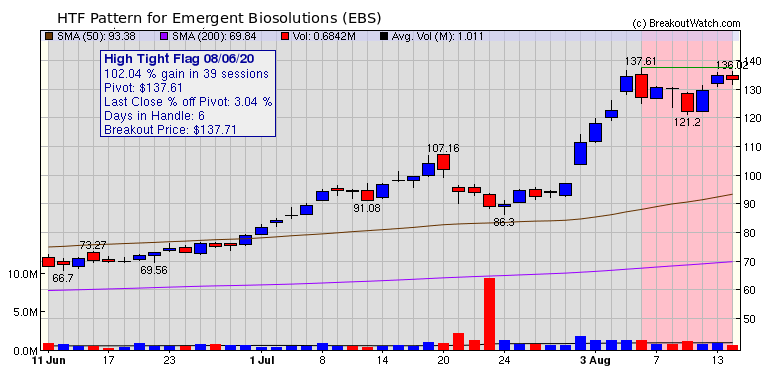
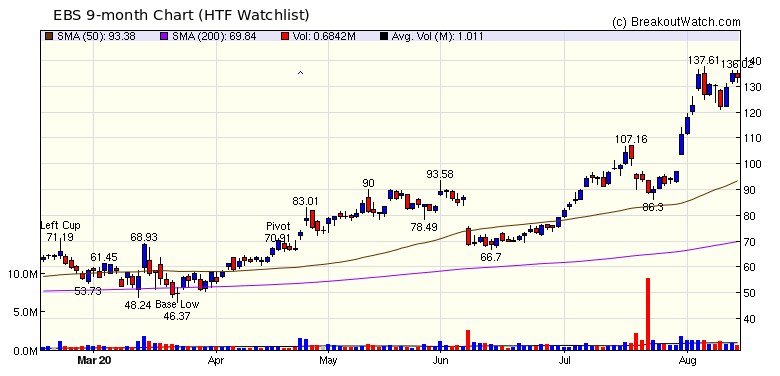
most promising High Tight Flag (HTF) stock this week is Emergent
BioSolutions (EBS). After setting a recent high, there was some
profit taking which has now reversed. This may be the result of
Jim
Cramer's interview with their CEO last Wednesday.   |
| No new features this week |
|
Our latest strategy
suggestions are here.
|
| List | Breakouts | Avg. Gain |
|---|---|---|
| CWH | 7 | 2.22 |
| SQZ | 4 | -5.75 |
| HTF | 2 | 0.6 |
| HSB | 0 | |
| DB | 1 | 7.07 |
| Brkout Date | Symbol | Base | Squeeze | Brkout Price | Brkout Day Close | RS Rank* | Last Close | Current % off BOP | Gain at Intraday High |
|---|---|---|---|---|---|---|---|---|---|
| 2020-08-10 | MESO | CWH | n | 16.40 | 17.42 | 95 | 17.88 | 9.02% | 19.51% |
| 2020-08-11 | APEI | DB | n | 32.95 | 36.34 | 78 | 35.28 | 7.07% | 24.37% |
| 2020-08-12 | XBIT | SQZ | y | 16.08 | 16.44 | 82 | 17.2 | 6.97% | 9.14% |
| 2020-08-13 | VRTV | SQZ | y | 16.85 | 17.87 | 81 | 17.87 | 6.05% | 9.85% |
| 2020-08-12 | BMCH | CWH | n | 32.71 | 33.3 | 80 | 33.83 | 3.42% | 3.45% |
| 2020-08-11 | ALB | CWH | n | 89.62 | 92.45 | 80 | 92.39 | 3.09% | 4.78% |
| 2020-08-13 | TXG | CWH | n | 101.46 | 104.77 | 80 | 102.71 | 1.23% | 3.37% |
| 2020-08-14 | NFE | HTF | n | 26.71 | 27.03 | 93 | 27.03 | 1.2% | 2.62% |
| 2020-08-13 | FUV | SQZ | y | 7.11 | 7.94 | 97 | 7.19 | 1.13% | 13.92% |
| 2020-08-12 | CGEN | CWH | n | 17.14 | 17.55 | 96 | 17.2 | 0.35% | 5.13% |
| 2020-08-10 | REZI | HTF | n | 13.86 | 14.2 | 92 | 13.86 | 0% | 7.5% |
| 2020-08-10 | SPSC | CWH | n | 77.76 | 78.17 | 83 | 77.33 | -0.55% | 6.51% |
| 2020-08-10 | MYRG | CWH | n | 38.85 | 38.87 | 83 | 38.46 | -1% | 2.78% |
| 2020-08-10 | FENC | SQZ | y | 9.02 | 10.17 | 90 | 5.67 | -37.14% | 18.29% |
| *RS Rank on day before breakout. | |||||||||
| Symbol | BO Price |
BO Vol. |
Company | Industry | RS Rank |
Last Close |
|---|---|---|---|---|---|---|
| FSK | 17.25 | 2,030,781 | FS KKR Capital Corp. | Asset Management | 98 | 16.14 |
| MIK | 8.79 | 7,224,225 | The Michaels Companies - Inc. | Specialty Retail | 95 | 8.36 |
| CBB | 15.12 | 771,248 | Cinci | Telecom Services | 94 | 15.07 |
| INSG | 15.25 | 6,209,206 | Inseego Corp. | Communication Equipment | 94 | 12.23 |
| EQT | 17.97 | 8,019,852 | EQT Corporation | Oil & Gas E&P | 93 | 16.96 |
| VMD | 11.98 | 675,950 | Viemed Healthcare - Inc. | Medical Devices | 90 | 10.42 |
| RAD | 18.64 | 5,567,046 | Rite Aid Corporation | Pharmaceutical Retailers | 89 | 15.12 |
| DLTH | 8.59 | 595,174 | Duluth Holdings Inc. | Apparel Retail | 88 | 8.19 |
| TPC | 13.90 | 669,672 | Tutor Perini Corporation | Engineering & Construction | 85 | 12.88 |
| AVID | 9.66 | 628,820 | Avid Technology - Inc. | Electronic Gaming & Multimedia | 83 | 8.33 |
| These stocks meet our suggested screening factors
for our Cup and Handle Chart Pattern watchlist. See Revised Rules for Trading Cup and Handle Breakouts |
||||||
| Index | Value | Change Week | Change YTD | Trend1 |
|---|---|---|---|---|
| Dow | 27931 |
1.81% | -2.13% | Up |
| NASDAQ | 11019.3 |
0.08% | 22.81% | Up |
| S&P 500 | 3372.85 |
0.64% | 4.4% | Up |
|
1The Market Trend is derived from
our proprietary market model. The market model is described on
the site here.
2The site also shows industry rankings based on fundamentals, combined technical and fundamentals, and on price alone. The site also shows daily industry movements. |
||||
| 1 Week | 13 Weeks | 26 Weeks | Year-to-Date |
|---|---|---|---|
| Dow Jones |
NASDAQ Composite 22.24 |
NASDAQ Composite 13.24 |
NASDAQ Composite 22.81 |
| 1 Week | 3 Weeks | 13 Weeks | 26 Weeks |
|---|---|---|---|
| Silver |
Silver |
Medical Distribution |
| Agricultural Inputs 33 |
Agricultural Inputs 43 |
Residential Construction 73 |
Copper 128 |
| Charts of each industry rank and performance over 12 months are available on the site | |||
If you received this newsletter from a friend and you would like to receive it regularly please go to the BreakoutWatch.com site and you will then be able to register to receive the newsletter.
Copyright (c) 08/15/2020 NBIcharts, LLC dba BreakoutWatch.com. All
rights reserved.
" BreakoutWatch," the BreakoutWatch.com "eye" logo, and the slogan
"tomorrow's breakouts today" are service marks of NBIcharts LLC. All
other marks are the property of their respective owners, and are used
for descriptive purposes only.
BreakoutWatch is not affiliated with Investor's Business Daily or with Mr. William O'Neil. Our site, research and analysis is supported entirely by subscription and is free from advertising.