Breakoutwatch Weekly Summary 09/26/20
You are receiving this email because you are or were a
BreakoutWatch.com subscriber, or have subscribed to our weekly
newsletter. This newsletter summarizes the breakout events of the week
and provides additional guidance that does not fit into our daily
format. It is published each weekend.
Newsletter Archive: https://www.breakoutwatch.com/content/newsletters
| NASDAQ Gains for the Week but Trend
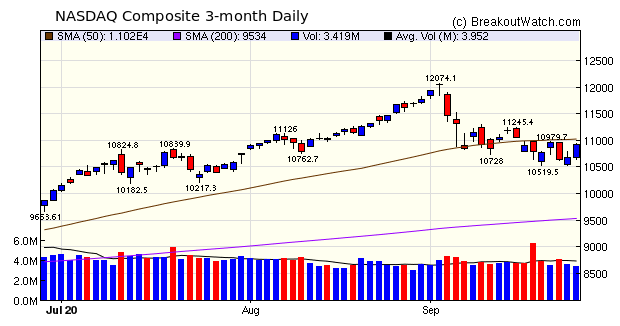
Indicators Still Negative The NASDAQ gained 1.1% over last Friday's close but the trend is flat and volumes below average. The S&P 500 and DJI were both in the red with losses of 0.6% and 1.8%, respectively. All three indexes made gains on Friday despite a slight uptick in jobless claims on Friday. The mega cap technology stocks led the gains but there was no specifically identified reason why. Traders may have taken upwardly revised durable goods orders for July as an indication the economy is strengthening. And of course, the Fed has promised near zero interest rates for the foreseeable future.  The Volatility Squeeze pattern
again delivered the most breakouts but it was last weeks chart
of the week (ZM) which delivered the best return from its High
Tight Flag pattern.
Did you know you can use
breakoutwatch on your mobile phone? I've been laboring for a few
months to improve rendering on phones and its getting quite
useful. Give it a try. Instructions are here.
|
For the chart of
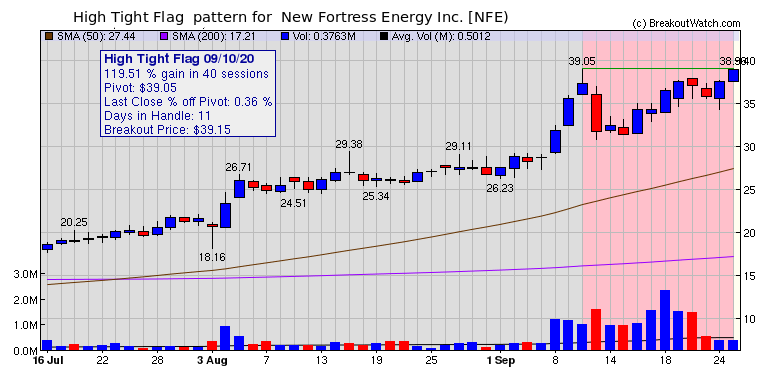
the week, I again turn to the High Tight Flag pattern and select
New Fortress Energy Inc. (NFE). Since forming the handle
the chart shows initial profit taking but a steady rise since
then on heavy volume. |
| No new features this week |
|
Our latest strategy
suggestions are here.
|
| List | Breakouts | Avg. Gain |
|---|---|---|
| CWH | 3 | -1.96 |
| SQZ | 7 | 3.07 |
| HTF | 1 | 3.87 |
| HSB | 0 | |
| DB | 1 | 2.54 |
| Brkout Date | Symbol | Base | Squeeze | Brkout Price | Brkout Day Close | RS Rank* | Last Close | Current % off BOP | Gain at Intraday High |
|---|---|---|---|---|---|---|---|---|---|
| 2020-09-24 | ATEC | SQZ | y | 6.20 | 6.55 | 87 | 6.94 | 11.94% | 12.54% |
| 2020-09-23 | LIQT | SQZ | y | 7.34 | 7.64 | 85 | 7.88 | 7.36% | 8.58% |
| 2020-09-21 | GH | CWH | n | 105.00 | 106.67 | 82 | 111.8 | 6.48% | 7.5% |
| 2020-09-25 | GDEN | SQZ | y | 13.19 | 14.01 | 83 | 14.01 | 6.22% | 7.58% |
| 2020-09-25 | ATEC | SQZ | y | 6.56 | 6.94 | 88 | 6.94 | 5.79% | 6.36% |
| 2020-09-22 | ZM | HTF | n | 478.00 | 492.6 | 99 | 496.5 | 3.87% | 10.82% |
| 2020-09-25 | ASND | DB | y | 150.21 | 154.03 | 74 | 154.03 | 2.54% | 2.68% |
| 2020-09-21 | SEED | SQZ | y | 9.69 | 10.7 | 91 | 9.93 | 2.48% | 11.76% |
| 2020-09-23 | JELD | SQZ | y | 20.93 | 21.62 | 85 | 21.17 | 1.15% | 4.63% |
| 2020-09-23 | TWTR | CWH | n | 44.09 | 45.33 | 82 | 43.84 | -0.57% | 6.19% |
| 2020-09-22 | SFIX | CWH | n | 29.75 | 31.38 | 85 | 26.24 | -11.8% | 6.22% |
| 2020-09-23 | ESCA | SQZ | y | 19.70 | 20.17 | 95 | 17.05 | -13.45% | 7.06% |
| *RS Rank on day before breakout. | |||||||||
| Symbol | BO Price |
BO Vol. |
Company | Industry | RS Rank |
Last Close |
|---|---|---|---|---|---|---|
| CLDX | 13.43 | 886,614 | Celldex Therapeutics - Inc. | Biotechnology | 99 | 12.80 |
| BCLI | 15.21 | 735,466 | Brainstorm Cell Therapeutics Inc. | Biotechnology | 97 | 14.95 |
| SURF | 7.75 | 1,281,874 | Surface Oncology - Inc. | Biotechnology | 97 | 6.31 |
| NG | 12.07 | 2,965,782 | Novagold Resources Inc. | Gold | 88 | 11.34 |
| CBB | 15.22 | 538,202 | Cinci | Telecom Services | 87 | 15.00 |
| SCPL | 16.98 | 1,256,300 | SciPlay Corporation | Electronic Gaming & Multimedia | 86 | 15.90 |
| UNIT | 10.50 | 2,164,030 | Uniti Group Inc. | REIT - Industrial | 81 | 9.81 |
| BCOV | 13.36 | 657,412 | Brightcove Inc. | Software - Application | 80 | 9.94 |
| These stocks meet our suggested screening factors
for our Cup and Handle Chart Pattern watchlist. See Revised Rules for Trading Cup and Handle Breakouts |
||||||
| Index | Value | Change Week | Change YTD | Trend1 |
|---|---|---|---|---|
| Dow | 27174 |
-1.75% | -4.78% | Down |
| NASDAQ | 10913.6 |
1.11% | 21.63% | Down |
| S&P 500 | 3298.46 |
-0.63% | 2.09% | Down |
|
1The Market Trend is derived from
our proprietary market model. The market model is described on
the site here.
2The site also shows industry rankings based on fundamentals, combined technical and fundamentals, and on price alone. The site also shows daily industry movements. |
||||
| 1 Week | 13 Weeks | 26 Weeks | Year-to-Date |
|---|---|---|---|
| NASDAQ Composite |
NASDAQ Composite 11.85 |
NASDAQ Composite 45.47 |
NASDAQ Composite 21.63 |
| 1 Week | 3 Weeks | 13 Weeks | 26 Weeks |
|---|---|---|---|
| Solar |
Silver |
Shell Companies |
| Tobacco 17 |
Coking Coal 74 |
Coking Coal 86 |
Copper 123 |
| Charts of each industry rank and performance over 12 months are available on the site | |||
If you received this newsletter from a friend and you would like to receive it regularly please go to the BreakoutWatch.com site and you will then be able to register to receive the newsletter.
Copyright (c) 09/26/2020 NBIcharts, LLC dba BreakoutWatch.com. All
rights reserved.
" BreakoutWatch," the BreakoutWatch.com "eye" logo, and the slogan
"tomorrow's breakouts today" are service marks of NBIcharts LLC. All
other marks are the property of their respective owners, and are used
for descriptive purposes only.
BreakoutWatch is not affiliated with Investor's Business Daily or with Mr. William O'Neil. Our site, research and analysis is supported entirely by subscription and is free from advertising.