Breakoutwatch Weekly Summary 11/14/20
You are receiving this email because you are or were a
BreakoutWatch.com subscriber, or have subscribed to our weekly
newsletter. This newsletter summarizes the breakout events of the week
and provides additional guidance that does not fit into our daily
format. It is published each weekend.
Newsletter Archive: https://www.breakoutwatch.com/content/newsletters
| Breakouts Average 7.9% Gain; NASDAQ
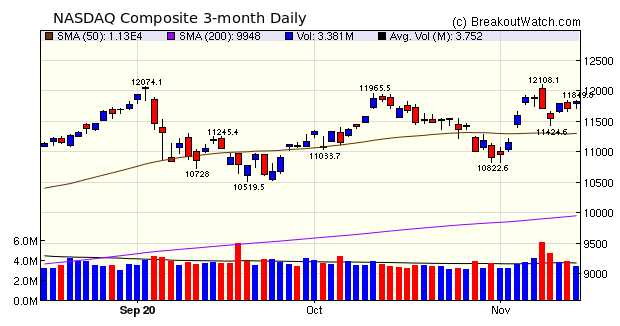
Retreats in Favor of Value and Cyclical Socks Positive news of supposedly imminent vaccine availability lifted confidence that the economy will recover strongly in 2021. We shall have to see if the logistical difficulties in distributing and injecting the Pfizer vaccine can be overcome, but even if not, there are other promising candidates with less stringent refrigeration requirements. The result was a focus on value and cyclical stocks that are expected to benefit from broader economic growth in 2021. The NASDAQ fell 0.6% due to profit taking in mega-cap tech stocks while the S&P 500 and Dow benefited by 2.1% and 4.1% respectively. Contributing to the confidence level was a forecast by Goldman Sachs that the S&P 500 will be at 4300 (+20%) by the end of 2021. Overlooked in this bullish outlook is the effects of increasing Covid hospitalizations and deaths and a warning by Fed Chairman Powell that the economy is in need of a stimulus. Markets are also expecting congressional gridlock to preserve prevailing tax policies for corporations, but this could change if Democrats win 2 senate seats in Georgia in January giving them control of the Senate.  As the breakout summary table below
shows, the bullish outlook led to strong gains in several
watchlist categories, with an average gain of 7.9%.
|
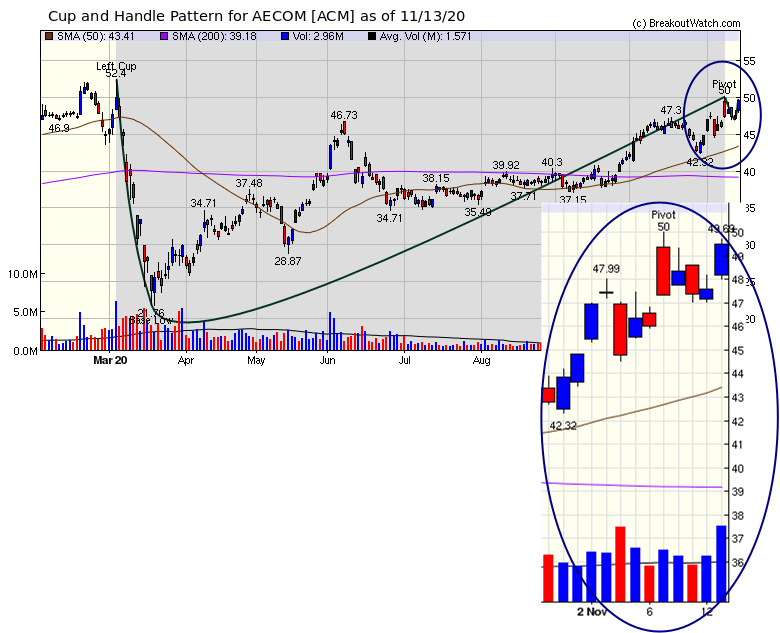
AECOM, one of the
world's leading construction conglomerates will announce Q3
earnings on Monday. Above average volume on Thursday followed by
2 times adv on Friday, indicates that earnings are expected to
be strong. |
| No new features this week |
|
Our latest strategy
suggestions are here.
|
| List | Breakouts | Avg. Gain |
|---|---|---|
| CWH | 9 | 6.89 |
| SQZ | 9 | 8.57 |
| HTF | 1 | 14.46 |
| HSB | 0 | |
| DB | 3 | 6.86 |
| Total | 22 | 7.9 |
| Brkout Date | Symbol | Base | Squeeze | Brkout Price | Brkout Day Close | RS Rank* | Last Close | Current % off BOP | Gain at Intraday High |
|---|---|---|---|---|---|---|---|---|---|
| 2020-11-12 | KZIA | SQZ | y | 6.62 | 7.73 | 94 | 10.05 | 51.81% | 51.81% |
| 2020-11-12 | CELH | CWH | n | 25.76 | 31.96 | 98 | 32.58 | 26.48% | 27.14% |
| 2020-11-10 | ATRA | DB | n | 14.91 | 15.58 | 75 | 18.05 | 21.06% | 29.31% |
| 2020-11-13 | MYOV | SQZ | y | 17.13 | 19.76 | 91 | 19.76 | 15.35% | 18.21% |
| 2020-11-09 | DAC | HTF | n | 9.89 | 10.09 | 94 | 11.32 | 14.46% | 25.68% |
| 2020-11-13 | FLGT | SQZ | y | 38.46 | 42.8 | 95 | 42.8 | 11.28% | 17% |
| 2020-11-09 | DFS | CWH | n | 69.94 | 76.19 | 80 | 76.61 | 9.54% | 12.65% |
| 2020-11-09 | BNTX | CWH | n | 97.29 | 104.8 | 97 | 106 | 8.95% | 18.2% |
| 2020-11-10 | MORF | SQZ | y | 27.40 | 28.09 | 89 | 29.71 | 8.43% | 9.89% |
| 2020-11-12 | NLTX | SQZ | y | 11.90 | 12.5 | 92 | 12.75 | 7.14% | 10% |
| 2020-11-09 | BKE | CWH | n | 26.26 | 29.2 | 89 | 27.5 | 4.72% | 18.81% |
| 2020-11-09 | VLRS | CWH | n | 9.24 | 9.55 | 82 | 9.6 | 3.9% | 14.39% |
| 2020-11-12 | BBIO | CWH | y | 42.19 | 43.05 | 86 | 43.52 | 3.15% | 4.36% |
| 2020-11-09 | RCKY | CWH | n | 29.71 | 30.45 | 80 | 30.53 | 2.76% | 10.2% |
| 2020-11-13 | HZN | CWH | y | 6.70 | 6.82 | 95 | 6.82 | 1.79% | 4.18% |
| 2020-11-09 | CHDN | DB | n | 178.00 | 180.33 | 82 | 180.85 | 1.6% | 14.14% |
| 2020-11-13 | VIPS | CWH | n | 22.87 | 23.03 | 84 | 23.03 | 0.7% | 3.54% |
| 2020-11-09 | SCPH | SQZ | y | 9.03 | 9.36 | 82 | 9.08 | 0.55% | 6.64% |
| 2020-11-12 | RVP | SQZ | y | 8.39 | 8.42 | 98 | 8.26 | -1.55% | 11.68% |
| 2020-11-12 | BCYC | DB | n | 20.75 | 20.78 | 90 | 20.32 | -2.07% | 3.45% |
| 2020-11-10 | RDVT | SQZ | y | 23.54 | 24.08 | 81 | 22.2 | -5.69% | 5.03% |
| 2020-11-09 | SSTI | SQZ | y | 32.50 | 35.67 | 83 | 29.18 | -10.22% | 10.71% |
| *RS Rank on day before breakout. | |||||||||
| Symbol | BO Price |
BO Vol. |
Company | Industry | RS Rank |
Last Close |
|---|---|---|---|---|---|---|
| FSM | 8.11 | 5,702,126 | Fortuna Silver Mines Inc | Silver | 93 | 7.12 |
| RESI | 13.69 | 1,564,546 | Front Yard Residential Corporation | REIT - Residential | 89 | 13.38 |
| ISEE | 6.69 | 1,373,542 | IVERIC bio - Inc. | Biotechnology | 89 | 6.21 |
| SVM | 8.10 | 1,885,389 | Silvercorp Metals Inc. | Silver | 89 | 7.60 |
| MOBL | 7.40 | 3,829,107 | MobileIron - Inc. | Software - Application | 87 | 7.02 |
| CBB | 15.35 | 598,734 | Cinci | Telecom Services | 87 | 15.23 |
| RC | 12.89 | 550,168 | Ready Capital Corproation | REIT - Mortgage | 86 | 12.61 |
| SILV | 10.90 | 1,115,972 | SilverCrest Metals Inc. | Other Industrial Metals & Mining | 86 | 9.89 |
| VG | 13.24 | 3,257,434 | Vonage Holdings Corp. | Telecom Services | 84 | 12.87 |
| CDE | 8.98 | 6,344,856 | Coeur Mining - Inc. | Gold | 84 | 8.15 |
| These stocks meet our suggested screening factors
for our Cup and Handle Chart Pattern watchlist. See Revised Rules for Trading Cup and Handle Breakouts |
||||||
| Index | Value | Change Week | Change YTD | Trend1 |
|---|---|---|---|---|
| Dow | 29479.8 |
4.08% | 3.3% | Up |
| NASDAQ | 11829.3 |
-0.55% | 31.84% | Up |
| S&P 500 | 3585.15 |
2.16% | 10.97% | Up |
|
1The Market Trend is derived from
our proprietary market model. The market model is described on
the site here.
2The site also shows industry rankings based on fundamentals, combined technical and fundamentals, and on price alone. The site also shows daily industry movements. |
||||
| 1 Week | 13 Weeks | 26 Weeks | Year-to-Date |
|---|---|---|---|
| Dow Jones |
NASDAQ Composite 7.35 |
NASDAQ Composite 31.22 |
NASDAQ Composite 31.84 |
| 1 Week | 3 Weeks | 13 Weeks | 26 Weeks |
|---|---|---|---|
| Home Improvement Retail |
Home Improvement Retail |
Grocery Stores |
| Food Distribution 49 |
Aluminum 51 |
Beverages - Wineries & Distilleries 93 |
Resorts & Casinos 99 |
| Charts of each industry rank and performance over 12 months are available on the site | |||
If you received this newsletter from a friend and you would like to receive it regularly please go to the BreakoutWatch.com site and you will then be able to register to receive the newsletter.
Copyright (c) 11/14/2020 NBIcharts, LLC dba BreakoutWatch.com. All
rights reserved.
" BreakoutWatch," the BreakoutWatch.com "eye" logo, and the slogan
"tomorrow's breakouts today" are service marks of NBIcharts LLC. All
other marks are the property of their respective owners, and are used
for descriptive purposes only.
BreakoutWatch is not affiliated with Investor's Business Daily or with Mr. William O'Neil. Our site, research and analysis is supported entirely by subscription and is free from advertising.