Breakoutwatch Weekly Summary 12/19/20
You are receiving this email because you are or were a
BreakoutWatch.com subscriber, or have subscribed to our weekly
newsletter. This newsletter summarizes the breakout events of the week
and provides additional guidance that does not fit into our daily
format. It is published each weekend.
Newsletter Archive: https://www.breakoutwatch.com/content/newsletters
| Cup and Handle Breakouts Deliver an
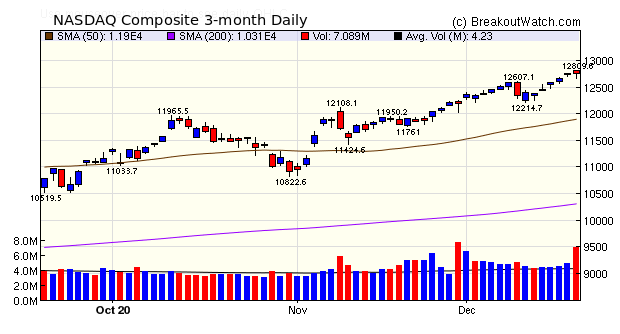
8.5% Gain The major indexes again made new highs this week, fueled by a promise from Fed Chairman Powell that policies will be supportive of the recovery expected next year until it is completed. Expectations that finally a Covid support package would be approved, together with the start of vaccinations, also contributed to the optimism. The chart shows high volume on Friday due to a rush by portfolio managers to prepare for Monday's entry of TESLA into the S&P 500. Managers of ETF's tracking the index will have to buy a lot of TESLA stock, so Friday saw a lot of selling in order to raise the projected $85 billion cash needed. That selling initially sent the index into a deep dive but buying in the last 15 minutes left it with just a 0.2% loss on the day.  Top breakout performer of the
week was software company Domo, Inc. with a 39% gain at
Friday's close. DOMO was on our list of probable breakouts on
last Friday's list of '
CwH Stocks Likely to Close above BoP at Next Session'
published daily in our Daily Newsletter. Read how to get the
most out of this list below.
|
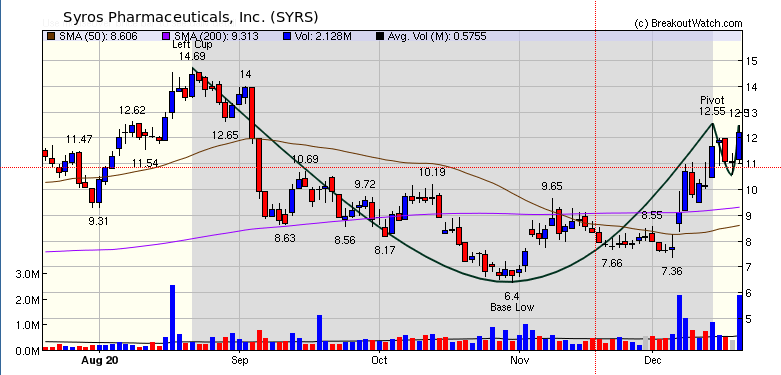
The high volume and
upward price move on Friday indicates SYRS could move higher on
Monday. This could be traded by placing a stop market order at
the breakout price of 12.55. |
| No new features this week |
|
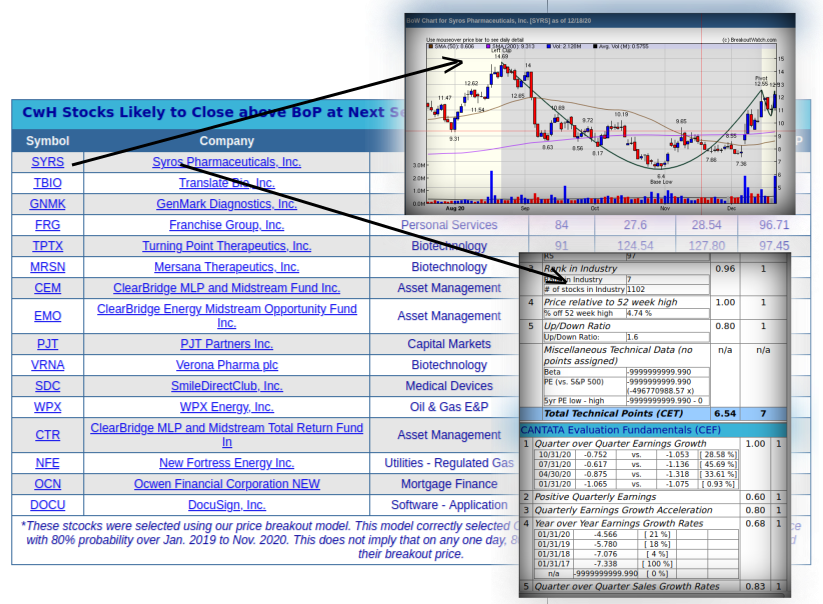
How to Use List of Stocks
Likely to Breakout
Each day in our Daily Newsletter
we publish a 'CwH Stocks Likely to Close above BoP at Next
Session'. To get, the most information from this list, I
suggest you click the link at the top of the newsletter read
the online version.
From there you can access a chart
of each stock and our CANTATA evaluation of the technical and
fundamental attributes of each stock.

Please note the footnote to this
list of stocks:
*These stcocks were selected using our price breakout model. This model correctly selected CWH stocks that met or exceeded their breakout price with 80% probability over Jan. 2019 to Nov. 2020. This does not imply that on any one day, 80% or any of the stocks selected will meet or exceed their breakout price. |
| List | Breakouts | Avg. Gain |
|---|---|---|
| CWH | 18 | 8.53 |
| SQZ | 63 | 3.78 |
| HTF | 2 | -8.8 |
| HSB | 0 | |
| DB | 0 |
| Brkout Date | Symbol | Base | Squeeze | Brkout Price | Brkout Day Close | RS Rank* | Last Close | Current % off BOP | Gain at Intraday High |
|---|---|---|---|---|---|---|---|---|---|
| 2020-12-14 | DOMO | CWH | n | 47.79 | 56.43 | 92 | 66.26 | 38.65% | 45.55% |
| 2020-12-17 | SEED | CWH | n | 10.42 | 11.5 | 80 | 13.87 | 33.11% | 46.55% |
| 2020-12-14 | LEU | CWH | n | 18.33 | 20.98 | 94 | 24.14 | 31.7% | 37.1% |
| 2020-12-14 | REGI | SQZ | y | 62.16 | 64.83 | 95 | 75.58 | 21.59% | 23.28% |
| 2020-12-15 | REGI | SQZ | y | 64.84 | 71.07 | 94 | 75.58 | 16.56% | 18.18% |
| 2020-12-14 | W | SQZ | y | 243.61 | 253.48 | 94 | 276.73 | 13.6% | 18.5% |
| 2020-12-15 | GLOB | SQZ | y | 189.55 | 194.83 | 80 | 213.35 | 12.56% | 12.62% |
| 2020-12-17 | LINC | SQZ | y | 6.36 | 6.86 | 90 | 7.12 | 11.95% | 13.99% |
| 2020-12-17 | USCR | SQZ | y | 36.86 | 37.7 | 83 | 40.84 | 10.8% | 12% |
| 2020-12-17 | BTAI | SQZ | y | 46.30 | 50.59 | 94 | 51.26 | 10.71% | 13.17% |
| 2020-12-17 | INMB | SQZ | y | 9.24 | 9.58 | 86 | 10.22 | 10.61% | 10.61% |
| 2020-12-16 | FSM | SQZ | y | 6.69 | 6.99 | 89 | 7.34 | 9.72% | 13.15% |
| 2020-12-17 | AEYE | CWH | n | 22.76 | 23.97 | 98 | 24.96 | 9.67% | 14.24% |
| 2020-12-14 | LPSN | SQZ | y | 58.00 | 58.5 | 88 | 63.51 | 9.5% | 11.66% |
| 2020-12-15 | W | SQZ | y | 253.49 | 272.23 | 95 | 276.73 | 9.17% | 13.88% |
| 2020-12-15 | MPWR | SQZ | y | 319.47 | 331.56 | 84 | 348.23 | 9% | 9.92% |
| 2020-12-17 | COUP | CWH | y | 337.89 | 356 | 90 | 366.9 | 8.59% | 8.62% |
| 2020-12-14 | XLRN | CWH | n | 125.38 | 130.01 | 86 | 134.95 | 7.63% | 8.08% |
| 2020-12-15 | SITE | SQZ | y | 143.50 | 148.44 | 81 | 153.96 | 7.29% | 8% |
| 2020-12-17 | SEAS | SQZ | y | 29.12 | 30.36 | 83 | 31.13 | 6.9% | 7.54% |
| 2020-12-18 | INMB | SQZ | y | 9.59 | 10.22 | 84 | 10.22 | 6.57% | 6.57% |
| 2020-12-15 | CTS | SQZ | y | 32.60 | 33.62 | 81 | 34.73 | 6.53% | 8.44% |
| 2020-12-15 | MGNX | SQZ | y | 23.77 | 24.73 | 89 | 25.27 | 6.31% | 18.59% |
| 2020-12-17 | PLAY | SQZ | y | 26.16 | 28.19 | 87 | 27.78 | 6.19% | 9.59% |
| 2020-12-18 | LPSN | SQZ | y | 59.82 | 63.51 | 89 | 63.51 | 6.17% | 8.26% |
| 2020-12-15 | MCFT | CWH | y | 24.35 | 25.05 | 87 | 25.8 | 5.95% | 9.2% |
| 2020-12-17 | DRD | SQZ | y | 11.26 | 11.96 | 81 | 11.92 | 5.86% | 10.66% |
| 2020-12-15 | IPHI | SQZ | y | 152.13 | 154.89 | 87 | 160.98 | 5.82% | 6.23% |
| 2020-12-16 | WLDN | SQZ | y | 39.56 | 39.75 | 80 | 41.79 | 5.64% | 8.22% |
| 2020-12-15 | VAPO | SQZ | y | 27.00 | 27.38 | 80 | 28.44 | 5.33% | 8.74% |
| 2020-12-17 | VCRA | CWH | n | 36.64 | 37.67 | 84 | 38.56 | 5.24% | 13.67% |
| 2020-12-14 | TPTX | SQZ | y | 118.62 | 126.44 | 93 | 124.54 | 4.99% | 7.74% |
| 2020-12-15 | GDS | SQZ | y | 90.58 | 90.83 | 80 | 95.03 | 4.91% | 6.52% |
| 2020-12-17 | MPWR | SQZ | y | 332.04 | 341.47 | 86 | 348.23 | 4.88% | 5.76% |
| 2020-12-17 | FSM | SQZ | y | 7.00 | 7.48 | 87 | 7.34 | 4.86% | 8.14% |
| 2020-12-15 | IMAB | SQZ | y | 38.20 | 39.8 | 85 | 39.83 | 4.27% | 8.3% |
| 2020-12-15 | VICR | CWH | y | 87.53 | 92.35 | 82 | 91.26 | 4.26% | 9.68% |
| 2020-12-16 | LOGI | CWH | n | 91.23 | 91.45 | 87 | 94.85 | 3.97% | 3.99% |
| 2020-12-16 | IPHI | SQZ | y | 154.90 | 154.93 | 87 | 160.98 | 3.93% | 4.34% |
| 2020-12-16 | GRWG | HTF | n | 37.31 | 38.71 | 98 | 38.65 | 3.59% | 6.67% |
| 2020-12-17 | BXC | CWH | y | 27.97 | 28.09 | 96 | 28.94 | 3.47% | 5.08% |
| 2020-12-17 | ALDX | SQZ | y | 7.30 | 7.53 | 90 | 7.53 | 3.15% | 6.16% |
| 2020-12-16 | AVLR | SQZ | y | 174.35 | 174.38 | 90 | 179.79 | 3.12% | 3.53% |
| 2020-12-16 | PFSI | SQZ | y | 62.30 | 63.94 | 83 | 64.24 | 3.11% | 6.23% |
| 2020-12-18 | BXC | SQZ | y | 28.10 | 28.94 | 96 | 28.94 | 2.99% | 4.59% |
| 2020-12-17 | DMAC | CWH | n | 7.15 | 7.2 | 88 | 7.32 | 2.38% | 7.01% |
| 2020-12-18 | DE | SQZ | y | 264.54 | 270.7 | 81 | 270.7 | 2.33% | 2.61% |
| 2020-12-15 | EDUC | SQZ | y | 16.44 | 16.89 | 93 | 16.81 | 2.25% | 9.06% |
| 2020-12-17 | WIX | SQZ | y | 267.92 | 270.05 | 87 | 273.45 | 2.06% | 3.39% |
| 2020-12-14 | NVDA | SQZ | y | 520.54 | 532.35 | 86 | 530.88 | 1.99% | 3.46% |
| 2020-12-17 | TWLO | CWH | n | 358.18 | 361.07 | 95 | 365.03 | 1.91% | 3.13% |
| 2020-12-15 | MBUU | SQZ | y | 63.81 | 64.71 | 83 | 64.95 | 1.79% | 5.73% |
| 2020-12-16 | W | SQZ | y | 272.24 | 273.09 | 96 | 276.73 | 1.65% | 6.04% |
| 2020-12-17 | NUS | SQZ | y | 51.75 | 52.24 | 80 | 52.44 | 1.33% | 3.67% |
| 2020-12-17 | W | SQZ | y | 273.10 | 285.06 | 97 | 276.73 | 1.33% | 5.7% |
| 2020-12-18 | BTAI | SQZ | y | 50.60 | 51.26 | 94 | 51.26 | 1.3% | 3.56% |
| 2020-12-18 | AVLR | SQZ | y | 177.67 | 179.79 | 90 | 179.79 | 1.19% | 1.45% |
| 2020-12-17 | PFGC | SQZ | y | 46.26 | 47.48 | 84 | 46.64 | 0.82% | 4.02% |
| 2020-12-17 | INFY | CWH | n | 16.09 | 16.21 | 81 | 16.22 | 0.81% | 1.62% |
| 2020-12-16 | AVTR | SQZ | y | 27.45 | 27.52 | 84 | 27.56 | 0.4% | 3.39% |
| 2020-12-18 | AVTR | SQZ | y | 27.45 | 27.56 | 84 | 27.56 | 0.4% | 0.87% |
| 2020-12-18 | NUS | SQZ | y | 52.25 | 52.44 | 85 | 52.44 | 0.36% | 2.68% |
| 2020-12-17 | EGO | SQZ | y | 12.80 | 13.29 | 81 | 12.83 | 0.23% | 4.99% |
| 2020-12-16 | GDOT | SQZ | y | 56.17 | 56.66 | 84 | 56.15 | -0.04% | 6.55% |
| 2020-12-15 | DELL | CWH | n | 72.97 | 73.74 | 80 | 72.92 | -0.07% | 3.32% |
| 2020-12-14 | OCN | SQZ | y | 26.56 | 26.71 | 99 | 26.51 | -0.19% | 4.63% |
| 2020-12-15 | NVDA | SQZ | y | 532.36 | 534.42 | 86 | 530.88 | -0.28% | 1.16% |
| 2020-12-15 | AMD | CWH | n | 96.37 | 97.12 | 88 | 95.92 | -0.47% | 1.67% |
| 2020-12-16 | EDUC | SQZ | y | 16.90 | 17.52 | 94 | 16.81 | -0.53% | 6.09% |
| 2020-12-17 | GDOT | SQZ | y | 56.67 | 56.85 | 84 | 56.15 | -0.92% | 5.61% |
| 2020-12-17 | SGMS | SQZ | y | 41.13 | 41.14 | 95 | 40.72 | -1% | 6.66% |
| 2020-12-17 | AMRK | SQZ | y | 31.14 | 31.63 | 93 | 30.82 | -1.03% | 2.6% |
| 2020-12-17 | LULU | CWH | n | 383.54 | 386.07 | 82 | 378.05 | -1.43% | 1% |
| 2020-12-17 | AVNS | CWH | n | 48.86 | 49.5 | 82 | 48 | -1.76% | 2.33% |
| 2020-12-15 | CVET | SQZ | y | 28.06 | 28.93 | 92 | 27.4 | -2.35% | 5.56% |
| 2020-12-14 | IMUX | SQZ | y | 18.09 | 18.75 | 87 | 17.62 | -2.6% | 5.58% |
| 2020-12-17 | GPI | SQZ | y | 122.07 | 125.13 | 87 | 118.14 | -3.22% | 4.56% |
| 2020-12-17 | SIC | SQZ | y | 7.69 | 7.7 | 87 | 7.41 | -3.64% | 2.34% |
| 2020-12-14 | CTSO | SQZ | y | 8.85 | 8.86 | 81 | 8.48 | -4.18% | 4.86% |
| 2020-12-15 | TCS | SQZ | y | 10.45 | 10.81 | 97 | 9.99 | -4.4% | 6.79% |
| 2020-12-15 | CLW | SQZ | y | 37.77 | 38.66 | 80 | 35.85 | -5.08% | 4.37% |
| 2020-12-14 | QDEL | SQZ | y | 202.57 | 206.93 | 89 | 189.5 | -6.45% | 5.02% |
| 2020-12-15 | RVP | HTF | n | 14.40 | 15.02 | 98 | 11.35 | -21.18% | 9.65% |
| *RS Rank on day before breakout. | |||||||||
| Symbol | BO Price |
BO Vol. |
Company | Industry | RS Rank |
Last Close |
|---|---|---|---|---|---|---|
| SURF | 10.72 | 1,684,068 | Surface Oncology - Inc. | Biotechnology | 97 | 9.04 |
| ATOM | 13.50 | 508,928 | Atomera Inco | Semiconductor Equipment & Materials | 94 | 12.38 |
| TAST | 7.48 | 667,970 | Carrols Restaurant Group - Inc. | Restaurants | 91 | 6.60 |
| GNMK | 14.61 | 1,355,750 | GenMark Diagnostics - Inc. | Medical Devices | 89 | 14.04 |
| ENLV | 13.77 | 516,678 | Enlivex Therapeutics Ltd. | Biotechnology | 89 | 10.89 |
| CNTY | 7.15 | 503,248 | Century Casinos - Inc. | Resorts & Casinos | 88 | 6.11 |
| WPX | 8.62 | 12,089,852 | WPX Energy - Inc. | Oil & Gas E&P | 86 | 8.05 |
| TACO | 9.57 | 967,414 | Del Taco Restaurants - Inc. | Restaurants | 84 | 9.14 |
| AQST | 8.06 | 912,986 | Aquestive Therapeutics - Inc. | Biotechnology | 84 | 6.92 |
| SSSS | 13.24 | 661,304 | SuRo Capital Corp. | Asset Management | 82 | 12.32 |
| These stocks meet our suggested screening factors
for our Cup and Handle Chart Pattern watchlist. See Revised Rules for Trading Cup and Handle Breakouts |
||||||
| Index | Value | Change Week | Change YTD | Trend1 |
|---|---|---|---|---|
| Dow | 30179.1 |
0.44% | 5.75% | Up |
| NASDAQ | 12755.6 |
3.05% | 42.16% | Up |
| S&P 500 | 3709.41 |
1.25% | 14.81% | Up |
|
1The Market Trend is derived from
our proprietary market model. The market model is described on
the site here.
2The site also shows industry rankings based on fundamentals, combined technical and fundamentals, and on price alone. The site also shows daily industry movements. |
||||
| 1 Week | 13 Weeks | 26 Weeks | Year-to-Date |
|---|---|---|---|
| NASDAQ Composite |
NASDAQ Composite 18.18 |
NASDAQ Composite 28.25 |
NASDAQ Composite 42.16 |
| 1 Week | 3 Weeks | 13 Weeks | 26 Weeks |
|---|---|---|---|
| Aluminum |
Home Improvement Retail |
Silver |
| Tobacco 40 |
Uranium 120 |
Textile Manufacturing 115 |
Aluminum 133 |
| Charts of each industry rank and performance over 12 months are available on the site | |||
If you received this newsletter from a friend and you would like to receive it regularly please go to the BreakoutWatch.com site and you will then be able to register to receive the newsletter.
Copyright (c) 12/19/2020 NBIcharts, LLC dba BreakoutWatch.com. All
rights reserved.
" BreakoutWatch," the BreakoutWatch.com "eye" logo, and the slogan
"tomorrow's breakouts today" are service marks of NBIcharts LLC. All
other marks are the property of their respective owners, and are used
for descriptive purposes only.
BreakoutWatch is not affiliated with Investor's Business Daily or with Mr. William O'Neil. Our site, research and analysis is supported entirely by subscription and is free from advertising.