Breakoutwatch Weekly Summary 01/09/21
You are receiving this email because you are or were a
BreakoutWatch.com subscriber, or have subscribed to our weekly
newsletter. This newsletter summarizes the breakout events of the week
and provides additional guidance that does not fit into our daily
format. It is published each weekend.
Newsletter Archive: https://www.breakoutwatch.com/content/newsletters
| Breakouts Gain 8.6%; Top Breakout
94%; NASDAQ Gain 2.4%; Bug Fixes The new year began with a continuation of the last year's momentum and each of the major indexes set new intraday and closing highs. The NASDAQ gained 2.4% and closed on Friday just 6 points short of its intraday high. The best performing index was the Russel 2000 with a 5.9%gain, indicating that small cap stocks are expected to perform well in 2021. The markets seemed unphased by the Republican loss of their Senate majority and instead anticipated further fiscal stimulus from the Democrats with control of the two houses Congress and the Presidency. 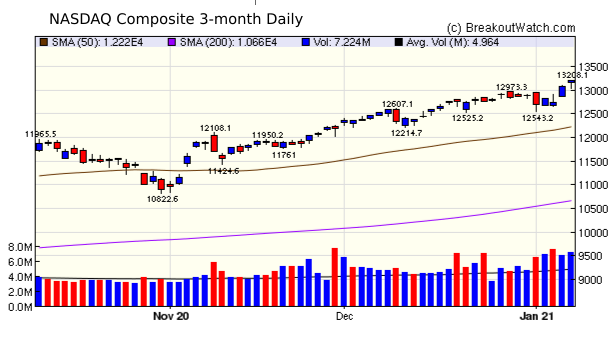 As can be seen in the list of
breakouts below, the number of breakouts, 113, greatly
exceeded the recent 4 week average of 54. Top breakout of the
week was MARA which broke out of a High Tight Flag (HTF) pattern
for a 94% gain.
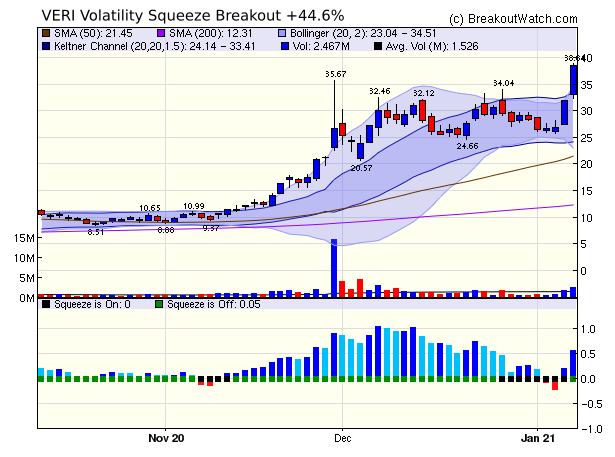
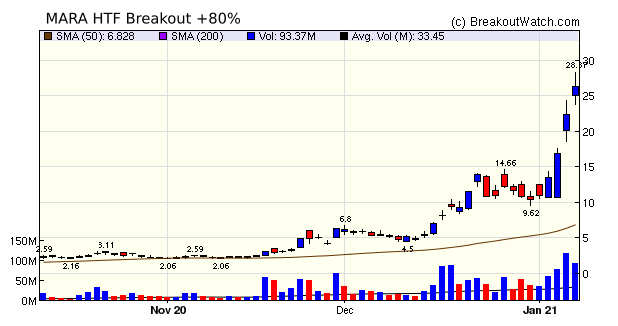 Best Volatility Squeeze Breakout
was VERI with an 80% gain.
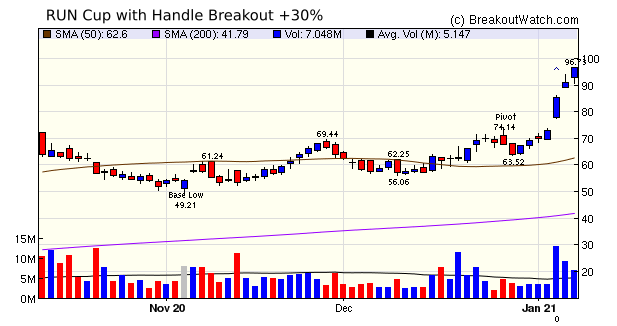
 Best Cup and Handle pattern breakot
was RUN with a 30% Gain
 |
Eyenovia, Inc. (EYEN) is my selection for the week. Although HTF
stocks have done well, the most frequent and reliable breakouts
come from the cup and handle pattern. EYEN had a very strong run
to set the latest pivot and after a profit taking in a short
handle looks ready to move higher.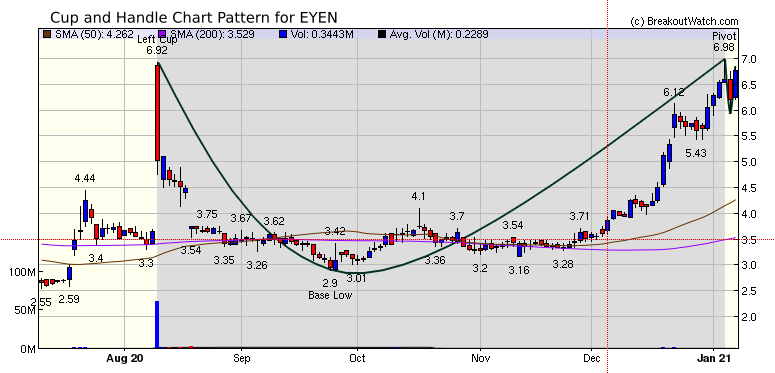 |
| A feature requested by a subscriber was the ability to be notified when a stock on their personal watchlist(s) appears on our watchlists. IF so, you will receive an email showing the name of your personal watchlist, the stock and the watchlist that it is currently on. For example: Bug Fixes:Personal Watchlist Stocks for Trading at Next Session PWL: QQQQ Symbol: QCOM Watchlist: Head and Shoulders Bottom PWL: QQQQ Symbol: GOOG Watchlist: Head and Shoulders Bottom PWL: QQQQ Symbol: NVDA Watchlist: Short Sale
|
|
Our latest strategy
suggestions are here.
|
| List | Breakouts | Avg. Gain |
|---|---|---|
| CWH | 19 | 5.61 |
| SQZ | 74 | 9.02 |
| HTF | 18 | 10.92 |
| HSB | 0 | |
| DB | 2 | 0.83 |
| Brkout Date | Symbol | Base | Squeeze | Brkout Price | Brkout Day Close | RS Rank* | Last Close | Current % off BOP | Gain at Intraday High |
|---|---|---|---|---|---|---|---|---|---|
| 2021-01-06 | MARA | HTF | n | 14.66 | 16.96 | 99 | 26.39 | 80.01% | 93.52% |
| 2021-01-06 | VERI | SQZ | y | 26.59 | 26.85 | 98 | 38.45 | 44.6% | 46.06% |
| 2021-01-04 | FUTU | SQZ | y | 45.76 | 48.94 | 96 | 64.53 | 41.02% | 45.8% |
| 2021-01-06 | RUN | CWH | n | 74.14 | 85.17 | 97 | 96.5 | 30.16% | 30.46% |
| 2021-01-04 | ODP | SQZ | y | 29.31 | 30.3 | 99 | 36.96 | 26.1% | 31.08% |
| 2021-01-06 | SIG | SQZ | y | 29.63 | 33.06 | 94 | 37.3 | 25.89% | 29.73% |
| 2021-01-04 | HOME | SQZ | y | 15.47 | 15.77 | 96 | 19.18 | 23.98% | 32.32% |
| 2021-01-06 | NIU | SQZ | y | 28.91 | 28.93 | 93 | 35.43 | 22.55% | 25.01% |
| 2021-01-07 | NIU | SQZ | y | 28.94 | 33.55 | 93 | 35.43 | 22.43% | 24.88% |
| 2021-01-04 | KRA | SQZ | y | 27.80 | 28.72 | 89 | 33.61 | 20.9% | 28.05% |
| 2021-01-04 | NIO | SQZ | y | 48.75 | 53.49 | 99 | 58.92 | 20.86% | 21.66% |
| 2021-01-08 | VERI | SQZ | y | 31.94 | 38.45 | 98 | 38.45 | 20.38% | 21.6% |
| 2021-01-05 | PLL | SQZ | y | 28.66 | 32.25 | 97 | 33.88 | 18.21% | 28.93% |
| 2021-01-05 | OII | HTF | n | 8.91 | 9.15 | 88 | 10.42 | 16.95% | 21.66% |
| 2021-01-06 | PRTY | HTF | n | 6.83 | 6.97 | 99 | 7.97 | 16.69% | 22.99% |
| 2021-01-06 | HOME | SQZ | y | 16.60 | 17.4 | 97 | 19.18 | 15.54% | 23.31% |
| 2021-01-08 | MYO | SQZ | y | 7.64 | 8.8 | 98 | 8.8 | 15.18% | 22.12% |
| 2021-01-06 | VFF | SQZ | y | 10.88 | 11.86 | 94 | 12.51 | 14.98% | 21.51% |
| 2021-01-06 | VOXX | SQZ | y | 12.75 | 14.04 | 93 | 14.62 | 14.67% | 18.51% |
| 2021-01-06 | GPI | SQZ | y | 127.81 | 141.65 | 88 | 146.42 | 14.56% | 17.31% |
| 2021-01-04 | DVN | SQZ | y | 15.82 | 16.13 | 82 | 18.11 | 14.48% | 21.81% |
| 2021-01-06 | WKHS | SQZ | y | 22.44 | 23.65 | 98 | 25.565 | 13.93% | 24.54% |
| 2021-01-07 | WPG | HTF | n | 7.83 | 7.96 | 99 | 8.79 | 12.26% | 20.56% |
| 2021-01-06 | CYRX | SQZ | y | 50.59 | 52.01 | 89 | 56.6 | 11.88% | 12.93% |
| 2021-01-06 | AMSC | HTF | n | 26.44 | 26.93 | 95 | 29.38 | 11.12% | 20.2% |
| 2021-01-06 | PLT | SQZ | y | 28.03 | 30.08 | 91 | 31.12 | 11.02% | 17.12% |
| 2021-01-06 | BOOT | SQZ | y | 43.77 | 47.86 | 89 | 48.59 | 11.01% | 11.74% |
| 2021-01-05 | ALT | SQZ | y | 12.72 | 12.75 | 96 | 14.12 | 11.01% | 16.75% |
| 2021-01-06 | ALT | SQZ | y | 12.76 | 12.8 | 95 | 14.12 | 10.66% | 16.38% |
| 2021-01-06 | SSL | CWH | n | 9.70 | 9.73 | 81 | 10.71 | 10.41% | 14.74% |
| 2021-01-07 | FUV | SQZ | y | 13.50 | 15.6 | 97 | 14.89 | 10.3% | 19.85% |
| 2021-01-07 | HOME | SQZ | y | 17.41 | 17.98 | 97 | 19.18 | 10.17% | 17.58% |
| 2021-01-07 | FCEL | HTF | n | 13.91 | 14.99 | 99 | 15.32 | 10.14% | 21.78% |
| 2021-01-06 | RAMP | CWH | y | 74.56 | 75.94 | 83 | 82.09 | 10.1% | 11.6% |
| 2021-01-07 | STIM | HTF | n | 11.71 | 12.07 | 97 | 12.89 | 10.08% | 11.19% |
| 2021-01-07 | TFFP | SQZ | y | 15.58 | 16.85 | 91 | 17.14 | 10.01% | 10.72% |
| 2021-01-07 | SSL | SQZ | y | 9.74 | 10.19 | 81 | 10.71 | 9.96% | 14.27% |
| 2021-01-04 | LAZY | SQZ | y | 16.26 | 16.38 | 97 | 17.83 | 9.66% | 21.89% |
| 2021-01-06 | MWK | HTF | n | 19.08 | 19.12 | 98 | 20.92 | 9.64% | 10.83% |
| 2021-01-06 | FOXF | CWH | n | 108.89 | 113.45 | 84 | 119.04 | 9.32% | 10.2% |
| 2021-01-06 | BJRI | CWH | n | 40.74 | 41.7 | 87 | 44.43 | 9.06% | 9.47% |
| 2021-01-06 | QTRX | SQZ | y | 44.71 | 47.02 | 83 | 48.74 | 9.01% | 11.79% |
| 2021-01-06 | CHUY | SQZ | y | 26.10 | 28.42 | 81 | 28.45 | 9% | 13.24% |
| 2021-01-06 | KRA | SQZ | y | 30.96 | 34.68 | 90 | 33.61 | 8.56% | 14.98% |
| 2021-01-07 | FET | SQZ | y | 13.27 | 13.93 | 99 | 14.4 | 8.52% | 9.72% |
| 2021-01-07 | SLP | CWH | n | 76.13 | 80.11 | 80 | 82.32 | 8.13% | 8.22% |
| 2021-01-07 | RAMP | SQZ | y | 75.95 | 80.62 | 84 | 82.09 | 8.08% | 9.56% |
| 2021-01-07 | WKHS | SQZ | y | 23.66 | 27.6 | 98 | 25.565 | 8.05% | 18.12% |
| 2021-01-06 | LAD | SQZ | y | 294.79 | 313.05 | 91 | 317.79 | 7.8% | 10.67% |
| 2021-01-06 | DKL | SQZ | y | 31.76 | 32.02 | 87 | 34.18 | 7.62% | 8.6% |
| 2021-01-07 | NETE | SQZ | y | 12.33 | 14.28 | 93 | 13.23 | 7.3% | 17.1% |
| 2021-01-05 | AGCO | CWH | n | 104.60 | 105.46 | 83 | 112.09 | 7.16% | 10.54% |
| 2021-01-06 | SEAS | SQZ | y | 30.65 | 32.47 | 88 | 32.81 | 7.05% | 12.69% |
| 2021-01-07 | CRSP | HTF | n | 181.42 | 194.43 | 94 | 193.82 | 6.83% | 15.97% |
| 2021-01-04 | GDOT | SQZ | y | 55.81 | 55.9 | 81 | 59.61 | 6.81% | 10.82% |
| 2021-01-08 | HOME | SQZ | y | 17.99 | 19.18 | 97 | 19.18 | 6.61% | 13.79% |
| 2021-01-04 | STAA | SQZ | y | 79.23 | 81.59 | 87 | 84.37 | 6.49% | 8.49% |
| 2021-01-04 | SGC | SQZ | y | 23.25 | 23.83 | 83 | 24.75 | 6.45% | 10.97% |
| 2021-01-06 | GNMK | CWH | n | 15.68 | 16.49 | 90 | 16.63 | 6.06% | 12.12% |
| 2021-01-08 | NIU | SQZ | y | 33.56 | 35.43 | 94 | 35.43 | 5.57% | 7.69% |
| 2021-01-06 | MATX | SQZ | y | 58.31 | 62.19 | 83 | 61.54 | 5.54% | 11.53% |
| 2021-01-06 | UAN | HTF | n | 16.53 | 18.13 | 99 | 17.44 | 5.51% | 13.37% |
| 2021-01-06 | GNRC | CWH | n | 239.62 | 246.29 | 86 | 252.5 | 5.38% | 8.51% |
| 2021-01-06 | RM | SQZ | y | 29.41 | 30.83 | 85 | 30.92 | 5.13% | 9.78% |
| 2021-01-06 | GRWG | HTF | n | 43.14 | 44.41 | 99 | 45.32 | 5.05% | 11.52% |
| 2021-01-06 | CASH | SQZ | y | 36.69 | 40.33 | 86 | 38.53 | 5.01% | 11.75% |
| 2021-01-07 | TEN | SQZ | y | 11.21 | 12.17 | 86 | 11.71 | 4.46% | 15.39% |
| 2021-01-08 | FTSI | SQZ | y | 18.45 | 19.27 | 97 | 19.27 | 4.44% | 5.85% |
| 2021-01-06 | TISI | SQZ | y | 10.62 | 11.73 | 80 | 11.06 | 4.14% | 13.75% |
| 2021-01-06 | MOD | HTF | y | 12.93 | 13.47 | 93 | 13.46 | 4.1% | 6.34% |
| 2021-01-07 | VOXX | SQZ | y | 14.05 | 14.92 | 94 | 14.62 | 4.06% | 7.54% |
| 2021-01-08 | REPL | SQZ | y | 41.12 | 42.78 | 92 | 42.78 | 4.04% | 4.55% |
| 2021-01-06 | NEON | SQZ | y | 8.04 | 8.14 | 92 | 8.36 | 3.98% | 9.45% |
| 2021-01-07 | VEL | SQZ | y | 6.79 | 7.07 | 83 | 7.05 | 3.83% | 9.35% |
| 2021-01-06 | SLM | CWH | n | 12.55 | 12.81 | 81 | 13.03 | 3.82% | 5.26% |
| 2021-01-05 | CLB | CWH | n | 29.85 | 30.42 | 84 | 30.98 | 3.79% | 11.22% |
| 2021-01-08 | DKL | CWH | n | 32.94 | 34.18 | 84 | 34.18 | 3.76% | 4.71% |
| 2021-01-06 | DLHC | SQZ | y | 9.60 | 9.83 | 80 | 9.96 | 3.75% | 6.77% |
| 2021-01-06 | VAC | SQZ | y | 136.13 | 144.84 | 82 | 141.14 | 3.68% | 7.85% |
| 2021-01-07 | QTRX | SQZ | y | 47.03 | 49 | 84 | 48.74 | 3.64% | 6.27% |
| 2021-01-05 | ETH | CWH | n | 20.66 | 20.89 | 84 | 21.41 | 3.63% | 7.26% |
| 2021-01-06 | EYE | CWH | y | 48.58 | 49.42 | 81 | 50.19 | 3.31% | 6.06% |
| 2021-01-06 | REZI | HTF | n | 22.85 | 22.86 | 94 | 23.6 | 3.28% | 3.85% |
| 2021-01-05 | APA | HTF | n | 16.14 | 16.18 | 76 | 16.58 | 2.73% | 8.43% |
| 2021-01-06 | PLCE | HTF | n | 52.17 | 56.83 | 87 | 53.52 | 2.59% | 11.83% |
| 2021-01-06 | MED | DB | n | 203.20 | 218.13 | 86 | 208.31 | 2.51% | 11.6% |
| 2021-01-05 | COHU | HTF | y | 41.00 | 41.5 | 94 | 42 | 2.44% | 5.93% |
| 2021-01-06 | EBIX | SQZ | y | 38.21 | 40.31 | 88 | 39.02 | 2.12% | 8.77% |
| 2021-01-06 | SSP | SQZ | y | 15.34 | 16.36 | 82 | 15.63 | 1.89% | 7.5% |
| 2021-01-08 | TFFP | SQZ | y | 16.86 | 17.14 | 93 | 17.14 | 1.66% | 2.31% |
| 2021-01-07 | EYE | SQZ | y | 49.43 | 50.04 | 83 | 50.19 | 1.54% | 4.24% |
| 2021-01-08 | ALT | SQZ | y | 13.91 | 14.12 | 95 | 14.12 | 1.51% | 6.76% |
| 2021-01-07 | DLHC | SQZ | y | 9.84 | 10 | 81 | 9.96 | 1.22% | 4.17% |
| 2021-01-07 | KWR | SQZ | y | 268.84 | 273.94 | 81 | 271.38 | 0.94% | 2.94% |
| 2021-01-08 | CVEO | HTF | n | 17.22 | 17.37 | 99 | 17.37 | 0.87% | 3.08% |
| 2021-01-08 | NBLX | CWH | n | 11.73 | 11.83 | 81 | 11.83 | 0.85% | 1.88% |
| 2021-01-06 | ANF | SQZ | y | 21.38 | 22.24 | 84 | 21.53 | 0.7% | 6.13% |
| 2021-01-06 | WTRE | SQZ | y | 34.70 | 34.76 | 84 | 34.8 | 0.29% | 0.3% |
| 2021-01-07 | RYTM | SQZ | y | 33.80 | 34.63 | 82 | 33.88 | 0.24% | 4.85% |
| 2021-01-07 | LAZY | CWH | n | 17.79 | 19.14 | 97 | 17.83 | 0.22% | 11.41% |
| 2021-01-08 | CLDX | SQZ | y | 17.50 | 17.53 | 97 | 17.53 | 0.17% | 2.34% |
| 2021-01-07 | GPS | SQZ | y | 21.42 | 21.5 | 84 | 21.42 | 0% | 2.26% |
| 2021-01-07 | GDOT | SQZ | y | 59.67 | 60.27 | 82 | 59.61 | -0.1% | 3.65% |
| 2021-01-06 | JELD | CWH | n | 26.45 | 26.84 | 81 | 26.41 | -0.15% | 3.21% |
| 2021-01-07 | SGC | SQZ | y | 24.94 | 25.65 | 84 | 24.75 | -0.76% | 3.45% |
| 2021-01-05 | JD | DB | n | 92.33 | 95.5 | 82 | 91.54 | -0.86% | 4.19% |
| 2021-01-07 | MATX | SQZ | y | 62.20 | 62.92 | 85 | 61.54 | -1.06% | 4.56% |
| 2021-01-05 | WLL | SQZ | y | 26.53 | 26.88 | 99 | 26.12 | -1.55% | 6.9% |
| 2021-01-07 | CIR | SQZ | y | 38.74 | 39.27 | 85 | 38.09 | -1.68% | 1.86% |
| 2021-01-07 | EPIX | HTF | n | 12.49 | 12.8 | 90 | 12.02 | -3.76% | 5.84% |
| 2021-01-07 | BTAI | CWH | n | 54.91 | 54.95 | 83 | 52.61 | -4.19% | 0.16% |
| 2021-01-06 | TACO | CWH | y | 9.65 | 9.7 | 80 | 9.24 | -4.25% | 3.21% |
| 2021-01-07 | CWH | SQZ | y | 28.72 | 28.81 | 91 | 27.5 | -4.25% | 2.65% |
| *RS Rank on day before breakout. | |||||||||
| Symbol | BO Price |
BO Vol. |
Company | Industry | RS Rank |
Last Close |
|---|---|---|---|---|---|---|
| PBI | 7.17 | 3,952,636 | Pitney Bowes Inc. | Business Equipment & Supplies | 90 | 6.91 |
| HL | 7.06 | 12,847,208 | Hecla Mining Company | Gold | 88 | 6.08 |
| ICLK | 9.10 | 1,325,866 | iClick Interactive Asia Group Limited | Advertising Agencies | 86 | 8.89 |
| SPWH | 18.08 | 2,705,730 | Sportsman's Warehouse Holdings - Inc. | Leisure | 81 | 17.54 |
| UROV | 16.15 | 595,142 | Urovant Sciences Ltd. | Biotechnology | 81 | 16.10 |
| These stocks meet our suggested screening factors
for our Cup and Handle Chart Pattern watchlist. See Revised Rules for Trading Cup and Handle Breakouts |
||||||
| Index | Value | Change Week | Change YTD | Trend1 |
|---|---|---|---|---|
| Dow | 31098 |
1.61% | 1.61% | Up |
| NASDAQ | 13202 |
2.43% | 2.43% | Up |
| S&P 500 | 3824.68 |
1.83% | 1.83% | Up |
|
1The Market Trend is derived from
our proprietary market model. The market model is described on
the site here.
2The site also shows industry rankings based on fundamentals, combined technical and fundamentals, and on price alone. The site also shows daily industry movements. |
||||
| 1 Week | 13 Weeks | 26 Weeks | Year-to-Date |
|---|---|---|---|
| NASDAQ Composite |
NASDAQ Composite 14.01 |
NASDAQ Composite 24.34 |
NASDAQ Composite 2.43 |
| 1 Week | 3 Weeks | 13 Weeks | 26 Weeks |
|---|---|---|---|
| Uranium |
Aluminum |
Silver |
| Department Stores 26 |
Solar 103 |
Aluminum 124 |
Textile Manufacturing 127 |
| Charts of each industry rank and performance over 12 months are available on the site | |||
If you received this newsletter from a friend and you would like to receive it regularly please go to the BreakoutWatch.com site and you will then be able to register to receive the newsletter.
Copyright (c) 01/09/2021 NBIcharts, LLC dba BreakoutWatch.com. All
rights reserved.
" BreakoutWatch," the BreakoutWatch.com "eye" logo, and the slogan
"tomorrow's breakouts today" are service marks of NBIcharts LLC. All
other marks are the property of their respective owners, and are used
for descriptive purposes only.
BreakoutWatch is not affiliated with Investor's Business Daily or with Mr. William O'Neil. Our site, research and analysis is supported entirely by subscription and is free from advertising.