Breakoutwatch Weekly Summary 01/15/21
You are receiving this email because you are or were a
BreakoutWatch.com subscriber, or have subscribed to our weekly
newsletter. This newsletter summarizes the breakout events of the week
and provides additional guidance that does not fit into our daily
format. It is published each weekend.
Newsletter Archive: https://www.breakoutwatch.com/content/newsletters
| NASDAQ Retreats from New High in
Face of Pandemic Surge, Increasing Unemployment and Threats of
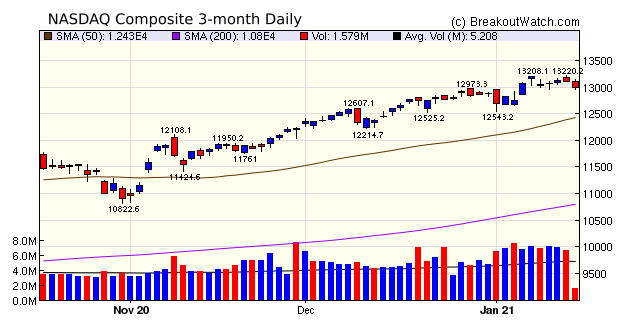
Violence The NASDAQ set another new high on Thursday but selling increased leaving the index with a loss on the day. Selling pressure increased on Friday as traders left their desks before the long weekend. For the week the NASDAQ lost 1.5%, led downwards mostly by weakness in the mega cap tech stocks Apple, Facebook and Amazon. The Covid 19 pandemic continues to threaten the pace of the economic recovery as evidenced by increasing unemployment claims and falling retail sales. The massive 1.9T stimulus proposed by the incoming Biden administration on Thursday might have been expected to lift markets, but didn't, perhaps because with a third of the country still believing the election was stolen, prospects for its bipartisan support are dim.  I'm a frequent follower of Barry
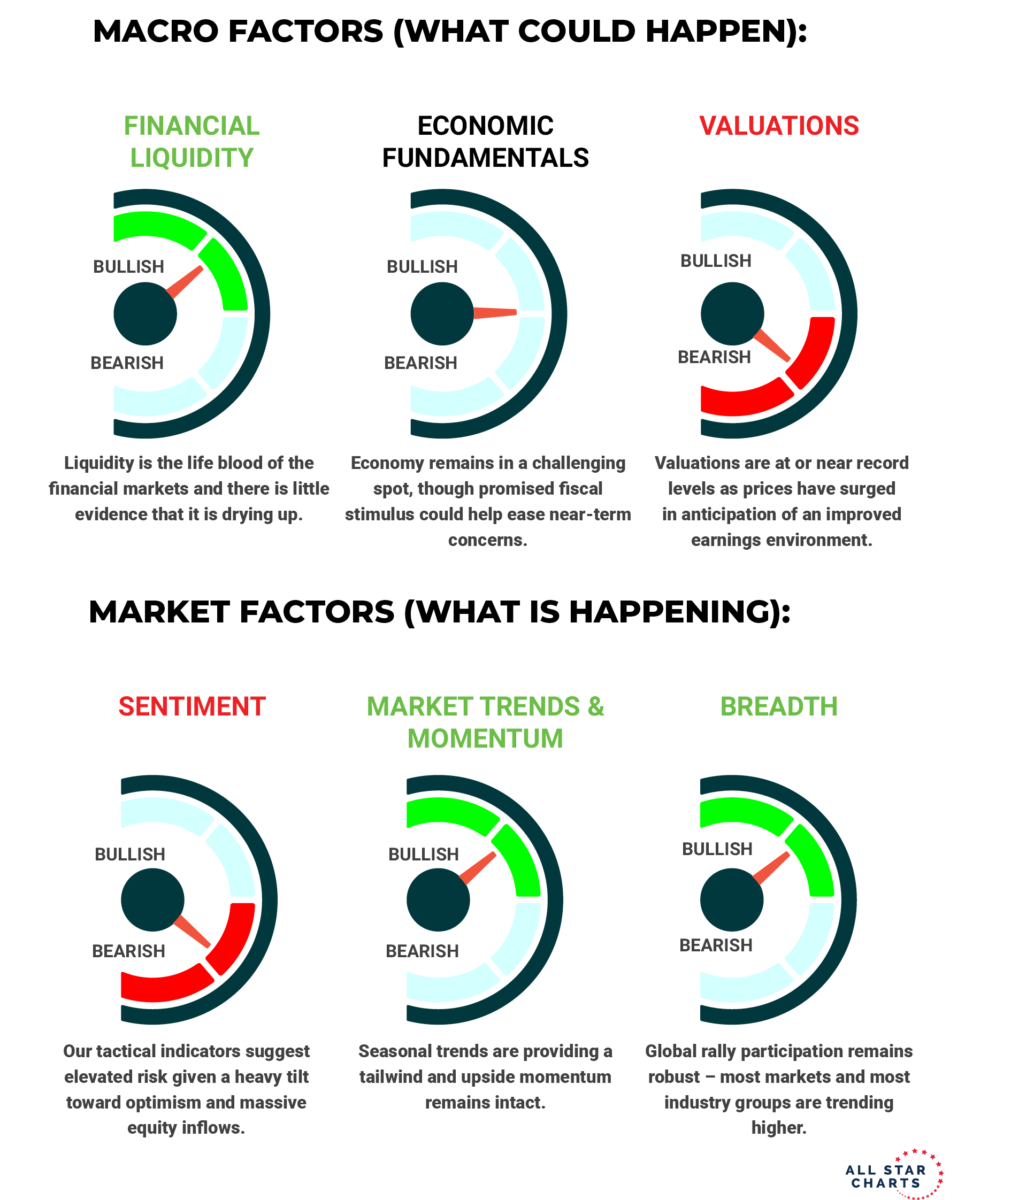
Ritholz' The Big Picture and on Friday he showed a graphic that
nicely summarizes prevailing macro and Market factors.
|
Moneygram
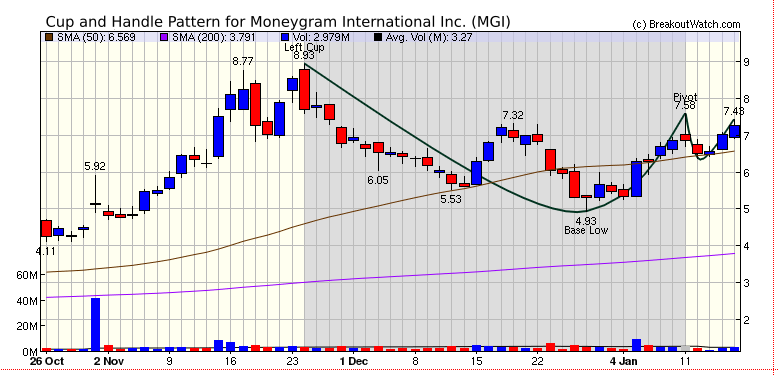
International (MGI) is showing classic right cup and right
handle characteristics. MGI closed 4% below the pivot on Friday
so it may be a couple of days before the breakout occurs. A
breakout would mean a target gain of 17% to the next resistance
level (left cup) would be possible. MGI is also listed on our
list of "CwH Stocks Likely to Close above BoP at Next Session"
with the highest probability. This list is published every day
in our Daily Newsletter.
 |
| No new features this week |
|
Our latest strategy
suggestions are here.
|
| List | Breakouts | Avg. Gain |
|---|---|---|
| CWH | 5 | 2.06 |
| SQZ | 45 | 3.78 |
| HTF | 3 | -1.08 |
| HSB | 0 | |
| DB | 0 |
| Brkout Date | Symbol | Base | Squeeze | Brkout Price | Brkout Day Close | RS Rank* | Last Close | Current % off BOP | Gain at Intraday High |
|---|---|---|---|---|---|---|---|---|---|
| 2021-01-12 | BBBY | SQZ | y | 20.50 | 21.53 | 89 | 25.595 | 24.85% | 35.32% |
| 2021-01-13 | BBBY | SQZ | y | 21.54 | 23.02 | 90 | 25.595 | 18.83% | 28.78% |
| 2021-01-12 | IDYA | SQZ | y | 14.93 | 15.45 | 83 | 16.85 | 12.86% | 16.36% |
| 2021-01-12 | GM | SQZ | y | 45.02 | 47.82 | 80 | 49.97 | 11% | 15.22% |
| 2021-01-11 | NBLX | SQZ | y | 11.84 | 11.87 | 81 | 13.04 | 10.14% | 14.27% |
| 2021-01-12 | NVAX | SQZ | y | 116.49 | 124.14 | 99 | 127.43 | 9.39% | 16.5% |
| 2021-01-13 | IDT | SQZ | y | 12.81 | 13.08 | 84 | 13.84 | 8.04% | 10.77% |
| 2021-01-15 | CYH | SQZ | y | 8.39 | 9.05 | 93 | 9.05 | 7.87% | 8.58% |
| 2021-01-12 | ALTM | SQZ | y | 48.15 | 49.18 | 97 | 51.91 | 7.81% | 10.38% |
| 2021-01-14 | RUTH | SQZ | y | 17.50 | 18.47 | 85 | 18.82 | 7.54% | 8.51% |
| 2021-01-13 | INSP | SQZ | y | 195.15 | 200.86 | 92 | 209.77 | 7.49% | 11.19% |
| 2021-01-12 | CWH | SQZ | y | 28.95 | 31.62 | 89 | 31.11 | 7.46% | 14.68% |
| 2021-01-11 | CMBM | SQZ | y | 26.67 | 26.98 | 95 | 28.6 | 7.24% | 12% |
| 2021-01-11 | CPS | SQZ | y | 37.47 | 42.14 | 94 | 40.04 | 6.86% | 14.79% |
| 2021-01-12 | NTG | CWH | n | 23.66 | 24.49 | 82 | 25.18 | 6.42% | 8.58% |
| 2021-01-14 | APPN | SQZ | y | 159.56 | 174.09 | 96 | 169.7 | 6.35% | 10.72% |
| 2021-01-14 | IDT | SQZ | y | 13.09 | 13.9 | 85 | 13.84 | 5.73% | 8.4% |
| 2021-01-12 | FRTA | SQZ | y | 18.62 | 18.65 | 85 | 19.54 | 4.94% | 6.5% |
| 2021-01-11 | CARV | SQZ | y | 7.08 | 7.12 | 90 | 7.43 | 4.94% | 24.97% |
| 2021-01-14 | INSP | SQZ | y | 200.87 | 211.47 | 92 | 209.77 | 4.43% | 8.02% |
| 2021-01-12 | CARV | SQZ | y | 7.13 | 7.48 | 90 | 7.43 | 4.21% | 24.1% |
| 2021-01-15 | ALTM | SQZ | y | 49.98 | 51.91 | 97 | 51.91 | 3.86% | 6.34% |
| 2021-01-11 | IHRT | SQZ | y | 13.29 | 13.33 | 80 | 13.8 | 3.84% | 4.21% |
| 2021-01-15 | CIICU | SQZ | y | 33.60 | 34.88 | 96 | 34.88 | 3.81% | 8.51% |
| 2021-01-12 | PBI | CWH | n | 7.17 | 24.49 | 91 | 7.44 | 3.77% | 13.74% |
| 2021-01-14 | SLCA | HTF | n | 9.23 | 9.82 | 96 | 9.55 | 3.47% | 7.69% |
| 2021-01-15 | CMLS | SQZ | y | 9.54 | 9.82 | 86 | 9.82 | 2.94% | 4.66% |
| 2021-01-12 | EGHT | HTF | n | 35.72 | 36.5 | 92 | 36.73 | 2.83% | 5.94% |
| 2021-01-15 | IGMS | SQZ | y | 94.48 | 97.15 | 82 | 97.15 | 2.83% | 5.36% |
| 2021-01-15 | VNE | SQZ | y | 22.80 | 23.31 | 84 | 23.31 | 2.24% | 2.96% |
| 2021-01-15 | FRTA | SQZ | y | 19.12 | 19.54 | 82 | 19.54 | 2.2% | 3.71% |
| 2021-01-13 | CLCT | SQZ | y | 76.36 | 76.4 | 94 | 77.48 | 1.47% | 1.85% |
| 2021-01-14 | CLCT | SQZ | y | 76.41 | 77.4 | 94 | 77.48 | 1.4% | 1.78% |
| 2021-01-15 | IRTC | SQZ | y | 247.11 | 250.57 | 89 | 250.57 | 1.4% | 3.19% |
| 2021-01-12 | WYY | SQZ | y | 11.61 | 124.14 | 99 | 11.74 | 1.12% | 16.57% |
| 2021-01-14 | HVT | CWH | n | 32.81 | 33.86 | 87 | 33.14 | 1.01% | 4.05% |
| 2021-01-12 | CIR | SQZ | y | 37.87 | 39.3 | 82 | 38.2 | 0.87% | 5.31% |
| 2021-01-15 | CLCT | SQZ | y | 77.41 | 77.48 | 94 | 77.48 | 0.09% | 0.47% |
| 2021-01-12 | MATX | CWH | n | 65.04 | 66.22 | 81 | 65.04 | 0% | 7.69% |
| 2021-01-14 | MESA | SQZ | y | 6.55 | 6.79 | 81 | 6.54 | -0.15% | 8.24% |
| 2021-01-13 | HYRE | SQZ | y | 8.11 | 8.55 | 96 | 8.09 | -0.25% | 8.51% |
| 2021-01-12 | NEON | CWH | n | 8.80 | 9.22 | 92 | 8.72 | -0.91% | 7.84% |
| 2021-01-12 | RENN | SQZ | y | 6.09 | 124.14 | 96 | 6.03 | -0.99% | 5.09% |
| 2021-01-14 | SRT | SQZ | y | 8.08 | 8.29 | 83 | 7.97 | -1.36% | 3.47% |
| 2021-01-12 | GPS | SQZ | y | 22.40 | 23.3 | 81 | 22.06 | -1.52% | 5.29% |
| 2021-01-14 | PK | SQZ | y | 17.76 | 18.02 | 81 | 17.33 | -2.42% | 3.04% |
| 2021-01-14 | PRTS | SQZ | y | 13.54 | 13.81 | 96 | 13.01 | -3.91% | 5.69% |
| 2021-01-13 | GOGO | SQZ | y | 11.44 | 11.62 | 95 | 10.98 | -4.02% | 17.48% |
| 2021-01-14 | TISI | SQZ | y | 11.39 | 11.83 | 86 | 10.9 | -4.3% | 6.23% |
| 2021-01-12 | NNBR | SQZ | y | 6.38 | 6.62 | 82 | 6.09 | -4.55% | 6.43% |
| 2021-01-12 | NETE | SQZ | y | 13.91 | 14.84 | 95 | 13.21 | -5.03% | 10.71% |
| 2021-01-12 | FUV | SQZ | y | 17.16 | 18.52 | 98 | 15.88 | -7.46% | 12.18% |
| 2021-01-12 | ONCS | HTF | n | 6.92 | 36.5 | 96 | 6.26 | -9.54% | -4.81% |
| *RS Rank on day before breakout. | |||||||||
| Symbol | BO Price |
BO Vol. |
Company | Industry | RS Rank |
Last Close |
|---|---|---|---|---|---|---|
| WYY | 13.53 | 768,718 | WidePoint Corporation | Information Technology Services | 99 | 11.74 |
| FUV | 19.25 | 5,289,170 | Arcimoto - Inc. | Recreational Vehicles | 98 | 15.88 |
| MGI | 7.58 | 4,904,786 | Moneygram International - Inc. | Credit Services | 96 | 7.27 |
| SPWH | 18.08 | 2,765,626 | Sportsman's Warehouse Holdings - Inc. | Leisure | 90 | 17.59 |
| SAVA | 12.98 | 5,149,640 | Cassava Sciences - Inc. | Biotechnology | 89 | 10.57 |
| SSSS | 14.75 | 627,982 | SuRo Capital Corp. | Asset Management | 84 | 14.12 |
| TEN | 12.94 | 1,503,086 | Tenneco Inc. | Auto Parts | 83 | 10.76 |
| These stocks meet our suggested screening factors
for our Cup and Handle Chart Pattern watchlist. See Revised Rules for Trading Cup and Handle Breakouts |
||||||
| Index | Value | Change Week | Change YTD | Trend1 |
|---|---|---|---|---|
| Dow | 30814.3 |
-0.91% | 0.68% | Up |
| NASDAQ | 12998.5 |
-1.54% | 0.86% | Up |
| S&P 500 | 3768.25 |
-1.48% | 0.32% | Up |
|
1The Market Trend is derived from
our proprietary market model. The market model is described on
the site here.
2The site also shows industry rankings based on fundamentals, combined technical and fundamentals, and on price alone. The site also shows daily industry movements. |
||||
| 1 Week | 13 Weeks | 26 Weeks | Year-to-Date |
|---|---|---|---|
| Dow Jones |
NASDAQ Composite 11.37 |
NASDAQ Composite 23.76 |
NASDAQ Composite 0.86 |
| 1 Week | 3 Weeks | 13 Weeks | 26 Weeks |
|---|---|---|---|
| Uranium |
Aluminum |
Silver |
| Electrical Equipment & Parts 50 |
Textile Manufacturing 113 |
Department Stores 125 |
Textile Manufacturing 127 |
| Charts of each industry rank and performance over 12 months are available on the site | |||
If you received this newsletter from a friend and you would like to receive it regularly please go to the BreakoutWatch.com site and you will then be able to register to receive the newsletter.
Copyright (c) 01/15/2021 NBIcharts, LLC dba BreakoutWatch.com. All
rights reserved.
" BreakoutWatch," the BreakoutWatch.com "eye" logo, and the slogan
"tomorrow's breakouts today" are service marks of NBIcharts LLC. All
other marks are the property of their respective owners, and are used
for descriptive purposes only.
BreakoutWatch is not affiliated with Investor's Business Daily or with Mr. William O'Neil. Our site, research and analysis is supported entirely by subscription and is free from advertising.
