Breakoutwatch Weekly Summary 01/23/21
You are receiving this email because you are or were a
BreakoutWatch.com subscriber, or have subscribed to our weekly
newsletter. This newsletter summarizes the breakout events of the week
and provides additional guidance that does not fit into our daily
format. It is published each weekend.
Newsletter Archive: https://www.breakoutwatch.com/content/newsletters
| Volatility Squeeze Stocks Outperfom
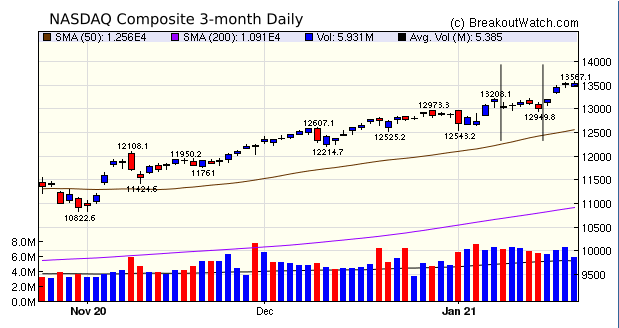
with 4.8% Average gain Volatility Squeeze breakouts fared better than cup and handle breakouts with an average gain of 4.75%. This is explained by the NASDAQ being flat the previous week, allowing the volatility of many stocks to fall inside their Bollinger Band. The flat area is shown between the vertical bars on the chart below. To understand the Volatility Squeeze pattern, see Volatility Squeeze Methodology. If new subscribers are wondering why I focus on the NASDAQ Composite each week, it's because most breakouts come from NASDAQ listed stocks. For example, this week, 30 breakouts, out of 41 came from the NASDAQ, 10 from the NYSE and one from the AMEX. That has been true for the 20 years that I have operated this site and will likely continue. This week, the NASDAQ was particularly strong with a 4.2% gain and every day the volume substantially exceeded the 50 day average. The mega tech stocks Apple (AAPL), Microsoft (MSFT), Amazon (AMZN), Alphabet (GOOG), and Facebook (FB) rose between 6-9% this week while NFLX shares surged 13.5%  |
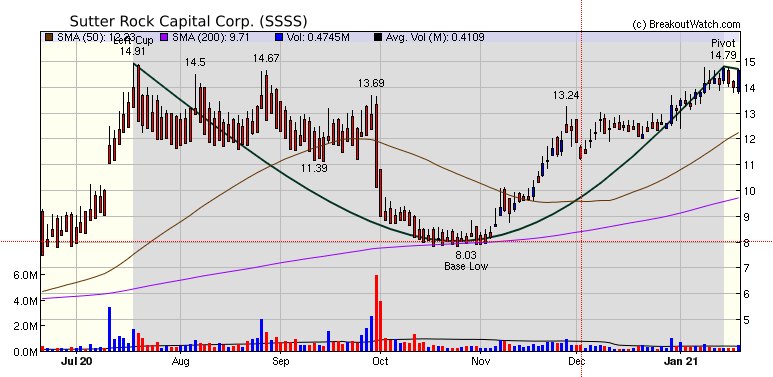
SuRo Capital Corp. (SSSS) specializes in growth capital, B round
and beyond, emerging growth, and pre-IPO investments in late
stage venture-backed private companies. SuRo 4.6% on Friday from
the bottom if its handle on above average volume and could move
higher on Monday
 |
| No new features this week |
|
Our latest strategy
suggestions are here.
|
| List | Breakouts | Avg. Gain |
|---|---|---|
| CWH | 12 | 1.28 |
| SQZ | 33 | 4.75 |
| HTF | 1 | 13.12 |
| HSB | 0 | |
| DB | 1 | 9.99 |
| Brkout Date | Symbol | Base | Squeeze | Brkout Price | Brkout Day Close | RS Rank* | Last Close | Current % off BOP | Gain at Intraday High |
|---|---|---|---|---|---|---|---|---|---|
| 2021-01-19 | IPWR | SQZ | y | 9.01 | 9.87 | 95 | 14 | 55.38% | 88.68% |
| 2021-01-19 | CLCT | SQZ | y | 77.49 | 77.8 | 93 | 91.65 | 18.27% | 18.47% |
| 2021-01-19 | USAK | SQZ | y | 9.54 | 10.36 | 80 | 11.05 | 15.83% | 24.32% |
| 2021-01-19 | SIC | SQZ | y | 7.71 | 7.72 | 91 | 8.81 | 14.27% | 16.6% |
| 2021-01-21 | DQ | HTF | n | 85.55 | 94.47 | 98 | 96.77 | 13.12% | 15.43% |
| 2021-01-19 | GNSS | SQZ | y | 7.14 | 7.38 | 86 | 7.95 | 11.34% | 13.45% |
| 2021-01-19 | FIZZ | DB | y | 89.50 | 92.68 | 74 | 98.44 | 9.99% | 10.61% |
| 2021-01-21 | FUV | CWH | n | 19.25 | 23.06 | 98 | 20.88 | 8.47% | 23.06% |
| 2021-01-22 | TTEC | SQZ | y | 76.92 | 82.89 | 83 | 82.89 | 7.76% | 10.1% |
| 2021-01-21 | FOSL | SQZ | y | 9.19 | 9.52 | 87 | 9.87 | 7.4% | 8.05% |
| 2021-01-22 | WYY | CWH | n | 13.53 | 14.49 | 99 | 14.49 | 7.1% | 10.79% |
| 2021-01-22 | SIC | SQZ | y | 8.26 | 8.81 | 87 | 8.81 | 6.66% | 8.84% |
| 2021-01-19 | NLS | SQZ | y | 19.95 | 20.03 | 96 | 21.18 | 6.17% | 7.72% |
| 2021-01-19 | AVNW | SQZ | y | 35.58 | 38 | 91 | 37.63 | 5.76% | 11.02% |
| 2021-01-20 | PK | SQZ | y | 17.29 | 18 | 81 | 18.16 | 5.03% | 5.32% |
| 2021-01-19 | IMRN | SQZ | y | 6.92 | 7.23 | 90 | 7.26 | 4.91% | 7.66% |
| 2021-01-22 | TISI | SQZ | y | 11.12 | 11.64 | 87 | 11.64 | 4.68% | 4.68% |
| 2021-01-21 | HOME | CWH | n | 23.89 | 24.75 | 98 | 24.93 | 4.35% | 6.78% |
| 2021-01-22 | LMPX | SQZ | y | 25.58 | 26.59 | 92 | 26.59 | 3.95% | 8.09% |
| 2021-01-21 | NLS | SQZ | y | 20.40 | 21.26 | 95 | 21.18 | 3.82% | 5.34% |
| 2021-01-21 | CHEF | SQZ | y | 27.59 | 28.54 | 83 | 28.62 | 3.73% | 3.95% |
| 2021-01-22 | GILT | CWH | n | 9.75 | 10.1 | 80 | 10.1 | 3.59% | 6.05% |
| 2021-01-19 | NETE | SQZ | y | 13.22 | 13.73 | 96 | 13.66 | 3.33% | 20.8% |
| 2021-01-22 | KODK | SQZ | y | 9.20 | 9.46 | 95 | 9.46 | 2.83% | 6.2% |
| 2021-01-22 | IDT | CWH | n | 14.27 | 14.65 | 86 | 14.65 | 2.66% | 3.15% |
| 2021-01-19 | IBP | CWH | y | 114.06 | 115.07 | 87 | 117.09 | 2.66% | 11.27% |
| 2021-01-22 | NSCO | SQZ | y | 7.49 | 7.66 | 89 | 7.66 | 2.27% | 2.34% |
| 2021-01-22 | CIICU | SQZ | y | 32.81 | 33.55 | 96 | 33.55 | 2.26% | 2.26% |
| 2021-01-19 | TACT | CWH | n | 9.86 | 10.01 | 85 | 10.03 | 1.72% | 3.75% |
| 2021-01-22 | LWAY | SQZ | y | 6.06 | 6.14 | 87 | 6.14 | 1.32% | 2.97% |
| 2021-01-22 | PK | SQZ | y | 17.98 | 18.16 | 83 | 18.16 | 1% | 1.28% |
| 2021-01-22 | MEC | SQZ | y | 13.49 | 13.61 | 81 | 13.61 | 0.89% | 1.42% |
| 2021-01-19 | IRTC | SQZ | y | 250.58 | 257.61 | 93 | 252.74 | 0.86% | 12.79% |
| 2021-01-22 | UROV | CWH | n | 16.19 | 16.24 | 84 | 16.24 | 0.31% | 0.31% |
| 2021-01-21 | RRR | SQZ | y | 25.67 | 25.88 | 85 | 25.75 | 0.31% | 1.56% |
| 2021-01-20 | GDEN | SQZ | y | 19.94 | 19.99 | 85 | 19.95 | 0.05% | 2.43% |
| 2021-01-20 | AVNW | SQZ | y | 38.01 | 38.64 | 93 | 37.63 | -1% | 3.92% |
| 2021-01-20 | PARR | SQZ | y | 14.23 | 14.37 | 82 | 14.04 | -1.34% | 1.9% |
| 2021-01-20 | RBBN | SQZ | y | 6.92 | 7.08 | 88 | 6.81 | -1.59% | 4.48% |
| 2021-01-20 | LAZY | CWH | n | 19.82 | 20.1 | 96 | 19.36 | -2.32% | 3.94% |
| 2021-01-20 | VNOM | CWH | n | 14.99 | 15.07 | 80 | 14.6 | -2.6% | 1.07% |
| 2021-01-19 | IGMS | SQZ | y | 97.16 | 102.5 | 89 | 94.29 | -2.95% | 9.82% |
| 2021-01-20 | MESA | SQZ | y | 6.83 | 6.9 | 84 | 6.61 | -3.22% | 3.07% |
| 2021-01-19 | HZNP | CWH | n | 81.16 | 81.2 | 87 | 77.73 | -4.23% | 1.75% |
| 2021-01-19 | ACMR | CWH | n | 104.26 | 104.72 | 85 | 97.6 | -6.39% | 2.91% |
| 2021-01-19 | ALTM | SQZ | y | 51.92 | 52.01 | 97 | 47.76 | -8.01% | 4.01% |
| 2021-01-20 | SNDX | SQZ | y | 23.90 | 23.98 | 87 | 20.23 | -15.36% | 1.67% |
| *RS Rank on day before breakout. | |||||||||
| Symbol | BO Price |
BO Vol. |
Company | Industry | RS Rank |
Last Close |
|---|---|---|---|---|---|---|
| SRNE | 10.78 | 24,975,022 | Sorrento Therapeutics - Inc. | Biotechnology | 89 | 9.64 |
| QRTEA | 12.51 | 6,489,272 | Qurate Retail - Inc. | Internet Retail | 89 | 11.73 |
| SSSS | 14.79 | 616,398 | SuRo Capital Corp. | Asset Management | 88 | 14.66 |
| EIGI | 9.49 | 1,390,946 | Endurance International Group Holdings - Inc. | Software - Application | 87 | 9.48 |
| SSL | 11.61 | 1,581,111 | Sasol Ltd. American Depos | Oil & Gas Integrated | 83 | 10.67 |
| CONN | 14.68 | 559,940 | Conn's - Inc. | Specialty Retail | 82 | 13.69 |
| These stocks meet our suggested screening factors
for our Cup and Handle Chart Pattern watchlist. See Revised Rules for Trading Cup and Handle Breakouts |
||||||
| Index | Value | Change Week | Change YTD | Trend1 |
|---|---|---|---|---|
| Dow | 30997 |
0.59% | 1.28% | Up |
| NASDAQ | 13543.1 |
4.19% | 5.08% | Up |
| S&P 500 | 3841.47 |
1.94% | 2.27% | Up |
|
1The Market Trend is derived from
our proprietary market model. The market model is described on
the site here.
2The site also shows industry rankings based on fundamentals, combined technical and fundamentals, and on price alone. The site also shows daily industry movements. |
||||
| 1 Week | 13 Weeks | 26 Weeks | Year-to-Date |
|---|---|---|---|
| NASDAQ Composite |
NASDAQ Composite 17.27 |
NASDAQ Composite 30.68 |
NASDAQ Composite 5.08 |
| 1 Week | 3 Weeks | 13 Weeks | 26 Weeks |
|---|---|---|---|
| Uranium |
Aluminum |
Silver |
| Residential Construction 35 |
Coking Coal 75 |
Department Stores 133 |
Department Stores 135 |
| Charts of each industry rank and performance over 12 months are available on the site | |||
If you received this newsletter from a friend and you would like to receive it regularly please go to the BreakoutWatch.com site and you will then be able to register to receive the newsletter.
Copyright (c) 01/23/2021 NBIcharts, LLC dba BreakoutWatch.com. All
rights reserved.
" BreakoutWatch," the BreakoutWatch.com "eye" logo, and the slogan
"tomorrow's breakouts today" are service marks of NBIcharts LLC. All
other marks are the property of their respective owners, and are used
for descriptive purposes only.
BreakoutWatch is not affiliated with Investor's Business Daily or with Mr. William O'Neil. Our site, research and analysis is supported entirely by subscription and is free from advertising.