Breakoutwatch Weekly Summary 03/13/21
You are receiving this email because you are or were a
BreakoutWatch.com subscriber, or have subscribed to our weekly
newsletter. This newsletter summarizes the breakout events of the week
and provides additional guidance that does not fit into our daily
format. It is published each weekend.
Newsletter Archive: https://www.breakoutwatch.com/content/newsletters
| Breakouts Average 6.6% This Week.
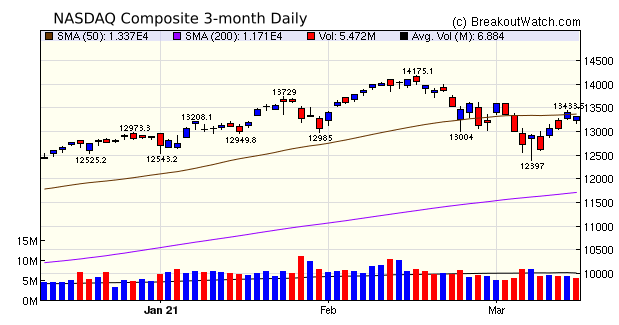
Trend Turns Positive for DJI and S&P 500 Friday's gains for The DJI (1%) and S&P 500 (0.1%) were sufficient to turn our trend indicators for those indexes positive. The trend for the NASDAQ, however, remains negative despite the index rising out of correction territory with a 3.1% gain for the week. On Thursday the index met with resistance at the 50 day average level and closed on Friday just below it. The index lagged the DJI which gained 4.1%. It's worth noting though that the Russell 2000 gained 7.3% and has risen 19.1% year to date, confirming that despite the focus on the large cap tech stocks, the rotation into the consumer discretionary sector is leading the way as the recovery gets moving helped massively by the injection of 1.9T into the economy and optimism that we could be almost back to 'normal' by July 4.  Volatility Squeeze (SQZ) breakouts
dominated the week with 69 breakouts and a 7% average gain. 19
SQZ stocks gained more than 10%. The Cup and Handle
pattern produce 10 breakouts with a 5% average gain. As a
reminder to new readers, a Volatility Squeeze occurs when the
Bollinger Bands tighten due to lower volatility and they fall to
within the Keltner Channel. See SQZ
Methodology.
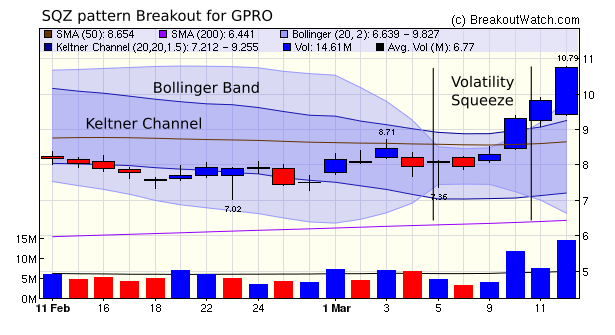
The top SQZ performer was Go Pro
(GPRO) with a 29.5% gain over breakout price. The indication
that a breakout was in process came on Wednesday (3/10) when
volume surged 100% over the 50 day average. We issued an alert
at 9:35 on Wednesday a $8.70. The stock subsequently gained
23.6%.
 |
|
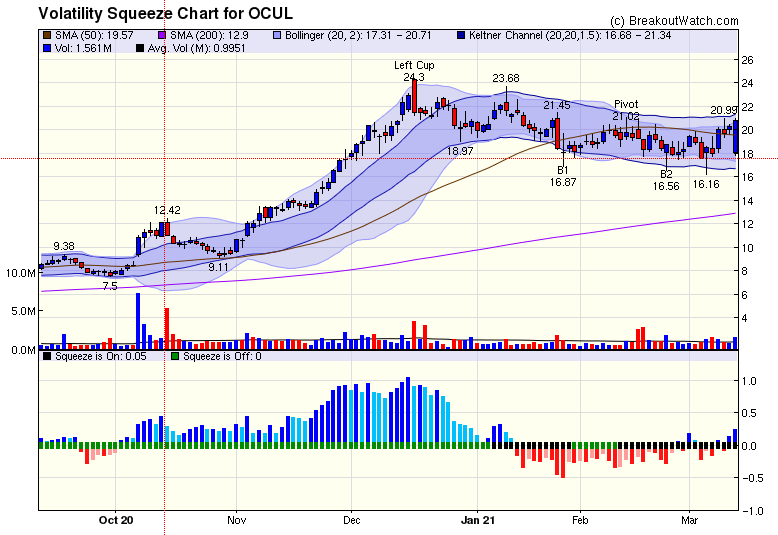
Ocular Therapeutix, Inc. [OCUL] Following on with the strength of Volatility Squeeze breakouts, this week I've chosen Healthcare/Biotechnology stock OCUL. Ocular Therapeutix has three eye treatment products in stage 3 clinical trials. OCUL failed to breakout from a cup and handle pattern in February and has since seen volatility fall so it qualifies for our Volatility Squeeze pattern. OCUL gained 15,5% on Friday on strong volume and may be ready to move higher on Monday.  |
| No new features this week |
|
Our latest strategy
suggestions are here.
|
| List | Breakouts | Avg. Gain |
|---|---|---|
| CWH | 10 | 5 |
| SQZ | 69 | 6.95 |
| HTF | 3 | 3.01 |
| HSB | 0 | |
| DB | 0 |
| Brkout Date | Symbol | Base | Squeeze | Brkout Price | Brkout Day Close | RS Rank* | Last Close | Current % off BOP | Gain at Intraday High |
|---|---|---|---|---|---|---|---|---|---|
| 2021-03-10 | GPRO | SQZ | y | 8.30 | 9.31 | 82 | 10.75 | 29.52% | 29.94% |
| 2021-03-09 | BSET | SQZ | y | 21.93 | 22.18 | 90 | 27.57 | 25.72% | 28.13% |
| 2021-03-08 | UNFI | SQZ | y | 31.51 | 31.83 | 95 | 39.18 | 24.34% | 29.17% |
| 2021-03-11 | FNKO | SQZ | y | 14.46 | 15.33 | 88 | 17.77 | 22.89% | 28.85% |
| 2021-03-09 | CYH | SQZ | y | 9.24 | 9.54 | 85 | 11.28 | 22.08% | 25% |
| 2021-03-08 | HOME | SQZ | y | 24.47 | 26.4 | 96 | 29.82 | 21.86% | 23.42% |
| 2021-03-08 | EDUC | SQZ | y | 15.97 | 16.18 | 87 | 18.98 | 18.85% | 22.1% |
| 2021-03-09 | EDUC | SQZ | y | 16.19 | 16.92 | 87 | 18.98 | 17.23% | 20.44% |
| 2021-03-11 | CYH | SQZ | y | 9.67 | 9.84 | 88 | 11.28 | 16.65% | 19.44% |
| 2021-03-09 | MYRG | SQZ | y | 63.48 | 65.91 | 84 | 73.59 | 15.93% | 16.35% |
| 2021-03-11 | GPRO | SQZ | y | 9.32 | 9.81 | 86 | 10.75 | 15.34% | 15.72% |
| 2021-03-08 | FLXS | SQZ | y | 33.45 | 35.41 | 91 | 37.99 | 13.57% | 13.99% |
| 2021-03-09 | M | SQZ | y | 16.51 | 17.11 | 85 | 18.73 | 13.45% | 14.05% |
| 2021-03-09 | HOME | SQZ | y | 26.41 | 28.21 | 97 | 29.82 | 12.91% | 14.35% |
| 2021-03-10 | EDUC | SQZ | y | 16.93 | 18.39 | 88 | 18.98 | 12.11% | 15.18% |
| 2021-03-11 | BSET | SQZ | y | 24.62 | 26.04 | 93 | 27.57 | 11.98% | 14.13% |
| 2021-03-08 | MBUU | SQZ | y | 80.05 | 83.93 | 83 | 89.04 | 11.23% | 12.01% |
| 2021-03-09 | JWN | SQZ | y | 37.35 | 37.62 | 80 | 41.37 | 10.76% | 11.59% |
| 2021-03-08 | GPI | SQZ | y | 157.18 | 162.38 | 85 | 173.55 | 10.41% | 11.36% |
| 2021-03-08 | HOFT | CWH | y | 35.98 | 37.13 | 80 | 39.26 | 9.12% | 11.03% |
| 2021-03-11 | AMRK | SQZ | y | 33.65 | 36.77 | 89 | 36.68 | 9% | 11.44% |
| 2021-03-08 | ESCA | SQZ | y | 21.40 | 21.75 | 85 | 23.31 | 8.93% | 9.8% |
| 2021-03-12 | CPS | SQZ | y | 43.31 | 47.12 | 91 | 47.12 | 8.8% | 9.35% |
| 2021-03-08 | HWC | CWH | n | 41.49 | 42.24 | 80 | 45.11 | 8.72% | 9.95% |
| 2021-03-08 | ABG | CWH | y | 176.22 | 180.06 | 85 | 191.05 | 8.42% | 8.84% |
| 2021-03-08 | DDS | SQZ | y | 84.92 | 85.09 | 91 | 91.68 | 7.96% | 9.44% |
| 2021-03-08 | CNR | SQZ | y | 12.82 | 13.83 | 85 | 13.84 | 7.96% | 11.47% |
| 2021-03-10 | PDS | SQZ | y | 25.37 | 26.52 | 99 | 27.33 | 7.73% | 13.6% |
| 2021-03-09 | ADTN | SQZ | y | 16.99 | 17.48 | 80 | 18.29 | 7.65% | 8.53% |
| 2021-03-10 | DAC | HTF | y | 44.46 | 45.4 | 99 | 47.73 | 7.35% | 11.47% |
| 2021-03-09 | FLXS | SQZ | y | 35.42 | 35.94 | 92 | 37.99 | 7.26% | 7.65% |
| 2021-03-09 | ESCA | SQZ | y | 21.76 | 21.98 | 87 | 23.31 | 7.12% | 7.99% |
| 2021-03-08 | CAL | SQZ | y | 17.41 | 18.51 | 84 | 18.64 | 7.06% | 9.42% |
| 2021-03-11 | ALTM | SQZ | y | 55.50 | 57.49 | 94 | 59.22 | 6.7% | 7.62% |
| 2021-03-08 | PDS | SQZ | y | 25.63 | 25.69 | 99 | 27.33 | 6.63% | 12.45% |
| 2021-03-11 | CPST | SQZ | y | 9.14 | 9.64 | 95 | 9.73 | 6.46% | 7.22% |
| 2021-03-10 | CADE | CWH | n | 22.52 | 22.73 | 91 | 23.79 | 5.64% | 5.86% |
| 2021-03-09 | DBI | SQZ | y | 14.60 | 15.25 | 86 | 15.36 | 5.21% | 8.15% |
| 2021-03-10 | CONN | SQZ | y | 15.70 | 16.41 | 82 | 16.51 | 5.16% | 6.88% |
| 2021-03-11 | ORGS | SQZ | y | 7.69 | 7.98 | 80 | 8.08 | 5.07% | 7.93% |
| 2021-03-11 | FMBI | CWH | n | 22.80 | 23.18 | 80 | 23.93 | 4.96% | 5.44% |
| 2021-03-11 | TNP | SQZ | y | 9.78 | 9.8 | 90 | 10.22 | 4.5% | 5.83% |
| 2021-03-12 | GRIN | CWH | n | 6.96 | 7.27 | 85 | 7.27 | 4.45% | 7.76% |
| 2021-03-12 | DDS | SQZ | y | 87.84 | 91.68 | 91 | 91.68 | 4.37% | 5.81% |
| 2021-03-12 | TNP | SQZ | y | 9.81 | 10.22 | 90 | 10.22 | 4.18% | 5.5% |
| 2021-03-12 | SLS | SQZ | y | 9.85 | 10.26 | 96 | 10.26 | 4.16% | 6.9% |
| 2021-03-10 | BSIG | SQZ | y | 19.45 | 20.25 | 84 | 20.17 | 3.7% | 6.04% |
| 2021-03-11 | ESCA | SQZ | y | 22.48 | 23.27 | 86 | 23.31 | 3.69% | 4.53% |
| 2021-03-11 | FFBC | CWH | n | 25.46 | 25.49 | 81 | 26.4 | 3.69% | 4.28% |
| 2021-03-11 | ARVN | SQZ | y | 74.19 | 77.87 | 94 | 76.86 | 3.6% | 5.27% |
| 2021-03-12 | ORGO | HTF | n | 17.11 | 17.72 | 98 | 17.72 | 3.57% | 4.15% |
| 2021-03-11 | DCP | CWH | n | 25.24 | 25.61 | 91 | 26.09 | 3.37% | 4.75% |
| 2021-03-11 | FLXS | SQZ | y | 36.77 | 36.98 | 91 | 37.99 | 3.32% | 3.7% |
| 2021-03-11 | EDUC | SQZ | y | 18.40 | 19.12 | 90 | 18.98 | 3.15% | 5.98% |
| 2021-03-11 | PDS | SQZ | y | 26.53 | 27.86 | 99 | 27.33 | 3.02% | 8.63% |
| 2021-03-12 | FLXS | SQZ | y | 36.99 | 37.99 | 89 | 37.99 | 2.7% | 3.08% |
| 2021-03-10 | NSYS | SQZ | y | 7.94 | 8.48 | 88 | 8.15 | 2.64% | 8.82% |
| 2021-03-12 | CRIS | SQZ | y | 10.64 | 10.92 | 98 | 10.92 | 2.63% | 3.29% |
| 2021-03-12 | OCUL | SQZ | y | 20.32 | 20.84 | 90 | 20.84 | 2.56% | 3.15% |
| 2021-03-11 | EGHT | SQZ | y | 34.37 | 35.31 | 86 | 35.25 | 2.56% | 4.02% |
| 2021-03-12 | AMSC | SQZ | y | 25.28 | 25.92 | 94 | 25.92 | 2.53% | 2.61% |
| 2021-03-10 | BZH | SQZ | y | 20.07 | 21.33 | 80 | 20.53 | 2.29% | 8.62% |
| 2021-03-08 | WRLD | SQZ | y | 143.94 | 150.21 | 80 | 146.76 | 1.96% | 5.58% |
| 2021-03-12 | ENSG | SQZ | y | 88.85 | 90.01 | 81 | 90.01 | 1.31% | 1.92% |
| 2021-03-12 | FCF | CWH | n | 15.34 | 15.51 | 80 | 15.51 | 1.11% | 1.43% |
| 2021-03-09 | CURO | SQZ | y | 15.48 | 15.61 | 90 | 15.62 | 0.9% | 6.33% |
| 2021-03-10 | PBI | SQZ | y | 9.15 | 9.38 | 93 | 9.23 | 0.87% | 5.68% |
| 2021-03-11 | CURO | SQZ | y | 15.49 | 15.97 | 89 | 15.62 | 0.84% | 6.26% |
| 2021-03-12 | CPST | SQZ | y | 9.65 | 9.73 | 95 | 9.73 | 0.83% | 1.55% |
| 2021-03-11 | ARLO | SQZ | y | 7.96 | 8.05 | 88 | 8.02 | 0.75% | 3.02% |
| 2021-03-09 | TSQ | SQZ | y | 10.47 | 10.51 | 84 | 10.54 | 0.67% | 2.2% |
| 2021-03-10 | ENBL | CWH | n | 7.19 | 7.33 | 88 | 7.23 | 0.56% | 3.13% |
| 2021-03-12 | TSQ | SQZ | y | 10.49 | 10.54 | 81 | 10.54 | 0.48% | 1.05% |
| 2021-03-11 | LMB | SQZ | y | 12.35 | 12.49 | 92 | 12.39 | 0.32% | 1.62% |
| 2021-03-12 | SID | SQZ | y | 6.71 | 6.72 | 92 | 6.72 | 0.15% | 0.15% |
| 2021-03-12 | ESCA | SQZ | y | 23.28 | 23.31 | 85 | 23.31 | 0.13% | 0.94% |
| 2021-03-11 | AROC | SQZ | y | 10.50 | 10.52 | 85 | 10.47 | -0.29% | 1.14% |
| 2021-03-11 | BSIG | SQZ | y | 20.26 | 20.38 | 85 | 20.17 | -0.44% | 1.8% |
| 2021-03-09 | CLB | SQZ | y | 37.93 | 38.32 | 80 | 37.46 | -1.24% | 10.69% |
| 2021-03-11 | MARA | HTF | n | 41.49 | 41.81 | 99 | 40.7 | -1.9% | 5.09% |
| 2021-03-10 | CMT | SQZ | y | 12.81 | 12.83 | 95 | 11.89 | -7.18% | 11.09% |
| 2021-03-09 | FOSL | SQZ | y | 17.67 | 18.33 | 94 | 14.51 | -17.88% | 9.39% |
| *RS Rank on day before breakout. | |||||||||
| Symbol | BO Price |
BO Vol. |
Company | Industry | RS Rank |
Last Close |
|---|---|---|---|---|---|---|
| No stocks met our suggested screening factors for
our Cup and Handle Chart Pattern watchlist. See Revised Rules for Trading Cup and Handle Breakouts |
||||||
| Index | Value | Change Week | Change YTD | Trend1 |
|---|---|---|---|---|
| Dow | 32778.6 |
4.07% | 7.1% | Up |
| NASDAQ | 13319.9 |
3.09% | 3.35% | Down |
| S&P 500 | 3943.34 |
2.64% | 4.99% | Up |
|
1The Market Trend is derived from
our proprietary market model. The market model is described on
the site here.
2The site also shows industry rankings based on fundamentals, combined technical and fundamentals, and on price alone. The site also shows daily industry movements. |
||||
| 1 Week | 13 Weeks | 26 Weeks | Year-to-Date |
|---|---|---|---|
| Dow Jones |
Dow Jones 7.61 |
NASDAQ Composite 22.72 |
Dow Jones 7.1 |
| 1 Week | 3 Weeks | 13 Weeks | 26 Weeks |
|---|---|---|---|
| Luxury Goods |
Luxury Goods |
Silver |
| Thermal Coal 88 |
Airlines 68 |
Oil & Gas Drilling 135 |
Department Stores 140 |
| Charts of each industry rank and performance over 12 months are available on the site | |||
If you received this newsletter from a friend and you would like to receive it regularly please go to the BreakoutWatch.com site and you will then be able to register to receive the newsletter.
Copyright (c) 03/13/2021 NBIcharts, LLC dba BreakoutWatch.com. All
rights reserved.
" BreakoutWatch," the BreakoutWatch.com "eye" logo, and the slogan
"tomorrow's breakouts today" are service marks of NBIcharts LLC. All
other marks are the property of their respective owners, and are used
for descriptive purposes only.
BreakoutWatch is not affiliated with Investor's Business Daily or with Mr. William O'Neil. Our site, research and analysis is supported entirely by subscription and is free from advertising.