Breakoutwatch Weekly Summary 10/23/21
You are receiving this email because you are or were a
BreakoutWatch.com subscriber, or have subscribed to our weekly
newsletter. This newsletter summarizes the breakout events of the week
and provides additional guidance that does not fit into our daily
format. It is published each weekend.
Newsletter Archive: https://www.breakoutwatch.com/content/newsletters
| Recent Recovery Creates More
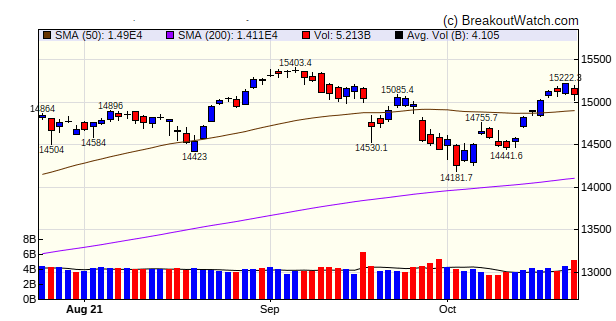
Breakout Opportunities The NASDAQ broke through the 50 day resistance level on Monday and our trend indicators all turned positive on Wednesday, October 20. The recovery has created more cup and handle pattern breakout opportunities as more stocks have qualified to be included on the cup and handle watchlist. For example, on Tuesday of this week there were 53 stocks on the CWH watchlist compared with just 16 on September 27. The recovery has also delivered more actual CWH breakouts with 17 this week compared to just 8, 3 weeks ago. The strength of the recovery is attributed to most companies that have reported Q3 earnings having beaten analysts estimates and a rotation out of growth stocks into value stocks. As a consequence, both the DJI and S&P 500 have set new highs while the NASDAQ, which has experienced consolidation in tech stocks, is 2% below its September 7 high. If the Democrats can reach agreement on their social agenda and pass that along with the infrastructure bill, then there should be ample fiscal stimulus to push the markets higher.  |
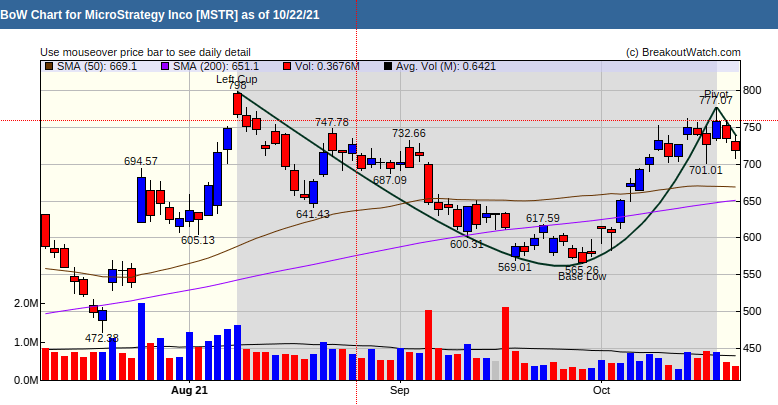
Our breakout price
model has selected MicroStrategy Inc. as being the cup and
handle pattern stock with the highest probability of a breakout,
although the stock has not yet started to build the right side
of its handle, The model rates the stock highly because of the
speed of the ascent of the right cup. The stock gapped up 5
times in 11 days. An immediate breakout is unlikely but could
come next week. |
| No new features this week |
|
Our latest strategy
suggestions are here.
|
| List | Breakouts | Avg. Gain |
|---|---|---|
| CWH | 17 | 1.16 |
| SQZ | 30 | 1.1 |
| HTF | 0 | |
| HSB | 0 | |
| DB | 0 |
| Brkout Date | Symbol | Base | Squeeze | Brkout Price | Brkout Day Close | RS Rank* | Last Close | Current % off BOP | Gain at Intraday High |
|---|---|---|---|---|---|---|---|---|---|
| 2021-10-18 | GGAL | SQZ | y | 10.75 | 10.77 | 91 | 11.41 | 6.14% | 9.09% |
| 2021-10-18 | VSTO | SQZ | y | 41.31 | 42 | 83 | 43.78 | 5.98% | 7.67% |
| 2021-10-18 | RCKY | SQZ | y | 50.91 | 51.4 | 80 | 53.76 | 5.6% | 7.74% |
| 2021-10-20 | MNSB | CWH | n | 24.68 | 24.84 | 82 | 26 | 5.35% | 8.79% |
| *RS Rank on day before breakout. | |||||||||
| Symbol | Company | Industry | RS Rank | Last Close | BoP | % off BoP |
|---|---|---|---|---|---|---|
| MSTR | MicroStrategy Inco | Software - Application | 96 | 718.52 | 777.07 | 92.47 |
| CVI | CVR Energy Inc. | Oil & Gas Refining & Marketing | 91 | 21.31 | 21.73 | 98.07 |
| ANET | Arista Networks, Inc. | Computer Hardware | 83 | 390.52 | 396.48 | 98.5 |
| PUMP | ProPetro Holding Corp. | Oil & Gas Equipment & Services | 91 | 10.2 | 10.56 | 96.59 |
| PBF | PBF Energy Inc. | Oil & Gas Refining & Marketing | 96 | 15.53 | 16.29 | 95.33 |
| CEQP | Crestwood Equity Partners | Oil & Gas Midstream | 87 | 29.95 | 30.50 | 98.2 |
| HOPE | Hope Bancorp, Inc. | Banks - Regional | 80 | 14.83 | 14.97 | 99.06 |
| DK | Delek US Holdings, Inc. | Oil & Gas Refining & Marketing | 85 | 21.25 | 22.16 | 95.89 |
| AKR | Acadia Realty Trust | REIT - Retail | 89 | 22.54 | 22.96 | 98.17 |
| WBS | Webster Financial Corporation | Banks - Regional | 84 | 58.14 | 58.68 | 99.08 |
| PVBC | Provident Bancorp, Inc. | Banks - Regional | 86 | 17.1 | 17.73 | 96.45 |
| ESTA | Establishment Labs Holdings Inc. | Medical Devices | 93 | 77 | 79.54 | 96.81 |
| UVSP | Univest Financial Corporation | Banks - Regional | 81 | 28.99 | 29.26 | 99.08 |
| SNV | Synovus Financial Corp. | Banks - Regional | 86 | 49.25 | 49.95 | 98.6 |
| GTYH | GTY Technology Holdings, Inc. | Software - Application | 90 | 7.78 | 8.04 | 96.77 |
| *These stocks were selected using our price breakout model. This model correctly selected CWH stocks that met or exceeded their breakout price with 80% probability over Jan. 2019 to Nov. 2020. This does not imply that on any one day, 80% or any of the stocks selected will meet or exceed their breakout price. | ||||||
| Symbol | BO Price |
BO Vol. |
Company | Industry | RS Rank |
Last Close |
|---|---|---|---|---|---|---|
| OII | 16.36 | 1,175,681 | Oceaneering International - Inc. | Oil & Gas Equipment & Services | 96 | 15.40 |
| PBF | 16.29 | 7,209,038 | PBF Energy Inc. | Oil & Gas Refining & Marketing | 96 | 15.53 |
| GEL | 11.95 | 1,390,406 | Genesis Energy - L.P. | Oil & Gas Midstream | 93 | 11.06 |
| GOSS | 14.30 | 813,120 | Gossamer Bio - Inc. | Biotechnology | 91 | 12.73 |
| PUMP | 10.56 | 1,245,828 | ProPetro Holding Corp. | Oil & Gas Equipment & Services | 91 | 10.20 |
| OIS | 7.28 | 1,019,048 | Oil States International - Inc. | Oil & Gas Equipment & Services | 87 | 6.62 |
| WTTR | 6.75 | 563,350 | Select Energy Services - Inc. | Oil & Gas Equipment & Services | 86 | 6.38 |
| GLNG | 14.36 | 1,489,873 | Golar LNG Limited | Oil & Gas Midstream | 80 | 13.52 |
| HOPE | 14.97 | 876,340 | Hope Bancorp - Inc. | Banks - Regional | 80 | 14.83 |
| WSR | 10.38 | 763,459 | Whitestone REIT | REIT - Retail | 80 | 9.85 |
| These stocks meet our suggested screening factors
for our Cup and Handle Chart Pattern watchlist. See Revised Rules for Trading Cup and Handle Breakouts |
||||||
| Index | Value | Change Week | Change YTD | Trend1 |
|---|---|---|---|---|
| Dow | 35677 |
1.08% | 16.57% | Up |
| NASDAQ | 15090.2 |
1.29% | 17.09% | Up |
| S&P 500 | 4544.9 |
1.64% | 21% | Up |
|
1The Market Trend is derived from
our proprietary market model. The market model is described on
the site here.
2The site also shows industry rankings based on fundamentals, combined technical and fundamentals, and on price alone. The site also shows daily industry movements. |
||||
| 1 Week | 13 Weeks | 26 Weeks | Year-to-Date |
|---|---|---|---|
| S&P 500 |
S&P 500 3.01 |
S&P 500 8.73 |
S&P 500 21 |
| 1 Week | 3 Weeks | 13 Weeks | 26 Weeks |
|---|---|---|---|
| Thermal Coal |
Uranium |
Luxury Goods |
Grocery Stores |
| Aerospace & Defense 0 |
Aerospace & Defense 0 |
Aerospace & Defense 0 |
Aerospace & Defense 0 |
| Charts of each industry rank and performance over 12 months are available on the site | |||
If you received this newsletter from a friend and you would like to receive it regularly please go to the BreakoutWatch.com site and you will then be able to register to receive the newsletter.
Copyright (c) 10/23/2021 Proactive Technologies, LLC dba
BreakoutWatch.com. All rights reserved.
" BreakoutWatch," the BreakoutWatch.com "eye" logo, and the slogan
"tomorrow's breakouts today" are service marks of Proactive Technologies
LLC. All other marks are the property of their respective owners, and
are used for descriptive purposes only.
BreakoutWatch is not affiliated with Investor's Business Daily or with Mr. William O'Neil. Our site, research and analysis is supported entirely by subscription and is free from advertising.