Breakoutwatch Weekly Summary 10/30/21
You are receiving this email because you are or were a
BreakoutWatch.com subscriber, or have subscribed to our weekly
newsletter. This newsletter summarizes the breakout events of the week
and provides additional guidance that does not fit into our daily
format. It is published each weekend.
Newsletter Archive: https://www.breakoutwatch.com/content/newsletters
| NASDAQ Sets New Intraday and
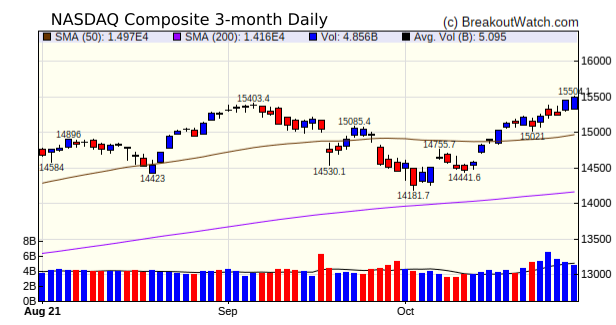
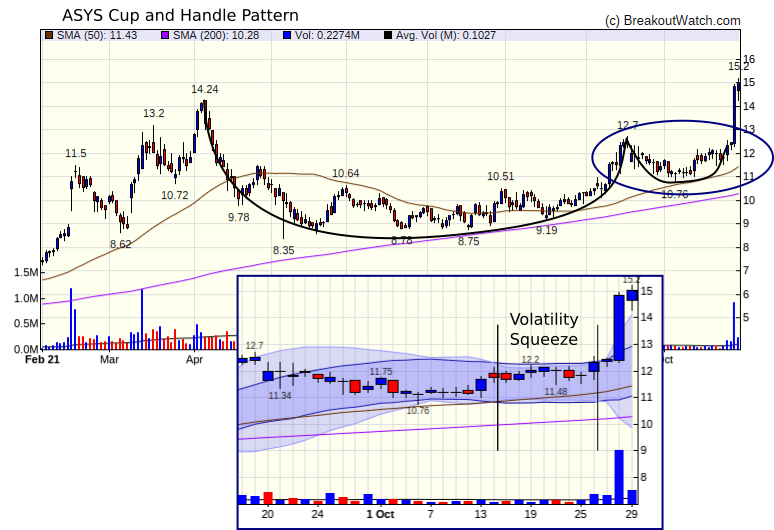
Closing High; ASYS Breakout Analysis The week was characterized by a strong showing among the mega cap stocks which gave the NASDAQ a weekly gain of 2.7% and a new closing high on Friday. Q3 earnings reported this week were mostly above expectations but forward guidance often identified continued supply chain issues as likely constraining future growth. The markets apparently viewed this as a short term problem for the big technology stocks and took a longer view that their future earnings justified higher valuations. This was not the case for AMAZON (AMZN), however, which fell 4% after reporting a 15% y-on-y earnings increase. TESLA (TSLA) was the week's biggest winner with a 22.5% gain after announcing a sale of 100,000 vehicles to Hertz. Among the week's breakouts, the Volatility Squeeze pattern outperformed the cup and handle with an average gain of 1.9%. There were some strong performers from both patterns, though, as the table below shows and 2 high performers from the High Tight Flag pattern.  ASYS Breakout Analysis
Amtech Systems, Inc. (ASYS) broke
out from a Volatility Squeeze pattern on Wednesday. As a
reminder, a volatility squeeze (SQZ) occurs when volatility in a
stock price falls to where the Bollinger Bands (a measure of
volatility) falls with the Keltner Channel (a measure of Average
True Range) When volatility returns to a 'normal' level there
can be a breakout to the up, or lower,side. We only show
volatility squeeze situations where a breakout to the upside is
likely. In the case of ASYS this week, the squeeze occurred
within a longer term cup and handle base. This was an indicator
that is a breakout did occur, then it was likely to be quite
strong.
 |
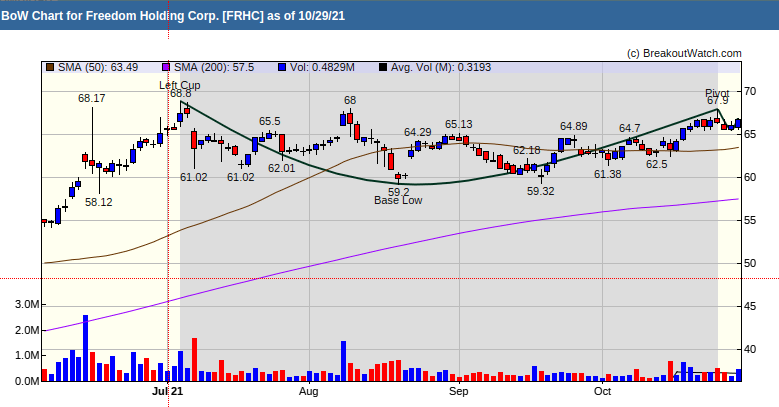
Freedom Holding Corp. is building the right side of it's handle and closed Friday on above average volume. According to our price model, it has the highest probability of breaking out on Monday.  |
| No new features this week |
|
Our latest strategy
suggestions are here.
|
| List | Breakouts | Avg. Gain |
|---|---|---|
| CWH | 14 | 0.17 |
| SQZ | 28 | 1.9 |
| HTF | 2 | 6.84 |
| HSB | 0 | |
| DB | 0 |
| Brkout Date | Symbol | Base | Squeeze | Brkout Price | Brkout Day Close | RS Rank* | Last Close | Current % off BOP | Gain at Intraday High |
|---|---|---|---|---|---|---|---|---|---|
| 2021-10-27 | ASYS | SQZ | y | 12.34 | 12.44 | 92 | 15.02 | 21.72% | 23.18% |
| 2021-10-26 | PERI | CWH | n | 23.37 | 29.08 | 94 | 28.42 | 21.61% | 29.14% |
| 2021-10-25 | SM | HTF | n | 32.07 | 32.63 | 99 | 34.32 | 7.02% | 16.43% |
| 2021-10-29 | METC | HTF | n | 17.43 | 18.59 | 99 | 18.59 | 6.66% | 8.72% |
| 2021-10-25 | SMPL | SQZ | y | 37.28 | 38.82 | 80 | 39.65 | 6.36% | 8.1% |
| 2021-10-28 | WNEB | SQZ | y | 9.22 | 9.84 | 84 | 9.73 | 5.53% | 8.21% |
| 2021-10-29 | USIO | SQZ | y | 6.02 | 6.35 | 95 | 6.35 | 5.48% | 7.14% |
| 2021-10-26 | PDLB | SQZ | y | 14.76 | 15.49 | 85 | 15.51 | 5.08% | 6.64% |
| *RS Rank on day before breakout. | |||||||||
| Symbol | Company | Industry | RS Rank | Last Close | BoP | % off BoP |
|---|---|---|---|---|---|---|
| FRHC | Freedom Holding Corp. | Capital Markets | 90 | 66.69 | 67.90 | 98.22 |
| PNRG | PrimeEnergy Resources Corporation | Oil & Gas E&P | 90 | 68.88 | 71.50 | 96.34 |
| RIVE | Riverview Financial Corporation | Banks - Regional | 86 | 13.28 | 13.56 | 97.94 |
| RCKY | Rocky Brands, Inc. | Footwear & Accessories | 86 | 54.55 | 55.09 | 99.02 |
| ESXB | Community Bankers Trust Corporation. | Banks - Regional | 91 | 11.66 | 11.85 | 98.4 |
| MSTR | MicroStrategy Inco | Software - Application | 95 | 715.06 | 777.07 | 92.02 |
| EXPI | eXp World Holdings, Inc. | Real Estate Services | 91 | 51.6 | 55.43 | 93.09 |
| FOE | Ferro Corporation | Specialty Chemicals | 82 | 21.02 | 21.20 | 99.15 |
| OZK | Bank OZK | Banks - Regional | 80 | 44.67 | 46.56 | 95.94 |
| SHOO | Steven Madden, Ltd. | Footwear & Accessories | 82 | 45.1 | 46.35 | 97.3 |
| TDC | Teradata Corporation | Information Technology Services | 95 | 56.56 | 59.38 | 95.25 |
| BWB | Bridgewater Bancshares, Inc. | Banks - Regional | 82 | 18.09 | 18.35 | 98.58 |
| SUM | Summit Materials, Inc. | Building Materials | 89 | 35.65 | 36.40 | 97.94 |
| *These stocks were selected using our price breakout model. This model correctly selected CWH stocks that met or exceeded their breakout price with 80% probability over Jan. 2019 to Nov. 2020. This does not imply that on any one day, 80% or any of the stocks selected will meet or exceed their breakout price. | ||||||
| Symbol | BO Price |
BO Vol. |
Company | Industry | RS Rank |
Last Close |
|---|---|---|---|---|---|---|
| OII | 16.36 | 1,220,964 | Oceaneering International - Inc. | Oil & Gas Equipment & Services | 94 | 13.60 |
| GOSS | 14.30 | 803,218 | Gossamer Bio - Inc. | Biotechnology | 90 | 12.42 |
| PUMP | 10.80 | 1,263,798 | ProPetro Holding Corp. | Oil & Gas Equipment & Services | 89 | 9.59 |
| WTTR | 6.77 | 560,561 | Select Energy Services - Inc. | Oil & Gas Equipment & Services | 82 | 6.01 |
| HOPE | 15.04 | 872,982 | Hope Bancorp - Inc. | Banks - Regional | 80 | 14.59 |
| These stocks meet our suggested screening factors
for our Cup and Handle Chart Pattern watchlist. See Revised Rules for Trading Cup and Handle Breakouts |
||||||
| Index | Value | Change Week | Change YTD | Trend1 |
|---|---|---|---|---|
| Dow | 35819.6 |
0.4% | 17.03% | Up |
| NASDAQ | 15498.4 |
2.71% | 20.25% | Up |
| S&P 500 | 4605.38 |
1.33% | 22.61% | Up |
|
1The Market Trend is derived from
our proprietary market model. The market model is described on
the site here.
2The site also shows industry rankings based on fundamentals, combined technical and fundamentals, and on price alone. The site also shows daily industry movements. |
||||
| 1 Week | 13 Weeks | 26 Weeks | Year-to-Date |
|---|---|---|---|
| NASDAQ Composite |
NASDAQ Composite 5.63 |
NASDAQ Composite 11 |
S&P 500 22.61 |
| 1 Week | 3 Weeks | 13 Weeks | 26 Weeks |
|---|---|---|---|
| Uranium |
Airports & Air Services |
Luxury Goods |
Grocery Stores |
| Aerospace & Defense 0 |
Aerospace & Defense 0 |
Aerospace & Defense 0 |
Aerospace & Defense 0 |
| Charts of each industry rank and performance over 12 months are available on the site | |||
If you received this newsletter from a friend and you would like to receive it regularly please go to the BreakoutWatch.com site and you will then be able to register to receive the newsletter.
Copyright (c) 10/30/2021 Proactive Technologies, LLC dba
BreakoutWatch.com. All rights reserved.
" BreakoutWatch," the BreakoutWatch.com "eye" logo, and the slogan
"tomorrow's breakouts today" are service marks of Proactive Technologies
LLC. All other marks are the property of their respective owners, and
are used for descriptive purposes only.
BreakoutWatch is not affiliated with Investor's Business Daily or with Mr. William O'Neil. Our site, research and analysis is supported entirely by subscription and is free from advertising.