Breakoutwatch Weekly Summary 11/06/21
You are receiving this email because you are or were a
BreakoutWatch.com subscriber, or have subscribed to our weekly
newsletter. This newsletter summarizes the breakout events of the week
and provides additional guidance that does not fit into our daily
format. It is published each weekend.
Newsletter Archive: https://www.breakoutwatch.com/content/newsletters
| Revised CWH Price Model gives 80%
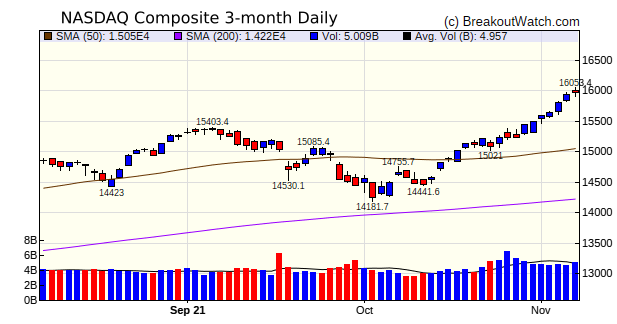
Breakout Success (See Strategy Suggestions) The NASDAQ composite, along with the other major indexes, continued to set new highs this week and gained a further 3.1%, surpassing the DJI (1.4%) and S&P 500 (2%). Smaller cap stocks did even better with the Russel 2000 gaining 6%. There were several reasons for the renewed optimism:
 There were 24 breakouts that closed
at least 5% above their breakout price, with most coming from
the Volatility Squeeze pattern. In the breakout table below, I
have highlighted in yellow those breakouts which were predicted
by the revised price model. You will see that 4 out of the 5 cup
and handle (CWH) breakouts were predicted by the model.
|
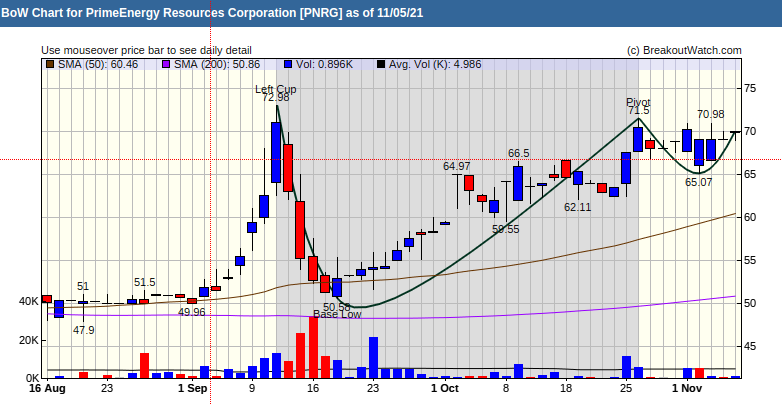
Our cup and handle
price model selected PNRG as the cup and handle watchlist stock
with the highest probability of breakout at the next session.
PNRG will announce Q3 earnings on November 23 |
| See Strategy Suggestions |
|
CWH Price Model
in my analysis Is
Breakout Day Volume Significant for Medium Term Success?
I showed that high breakout day volume was not necessary for
breakout stocks to perform well in the subsequent 28 days.
Consequently, I dropped the O'Neil rule requiring breakout day
volume to be 1.5 times average daily volume before considering
a breakout to have occurred. It follows that what we are
really interested in is those stocks that close above their
breakout price, regardless of volume.
If we can identify those stocks
that have a high probability of closing above their breakout
price, then we can place a buy at open trade with a stop limit
order at or below the breakout price with a reasonable chance
of success.
In pursuit of a model that would
identify stocks likely to close above their breakout price, i
performed a discriminant analysis of cup and handle pattern
stocks over the last 3 years. Cup and handle watchlist stocks
were analyzed as falling into two groups, breakout (BO) and no
breakout (No BO), determined by whether or not they closed
above their breakout price. When the resulting model was
applied over the almost 3 years 2019 to October 28 this year,
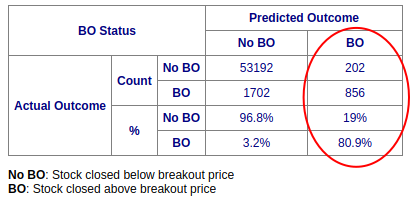
the results were as follows:
 The column to focus on is
circled. What it shows is that the model predicted 1058 stocks
would close above their breakout price (BOP) and 81%
(856) actually did close above their BOP. The
table also shows that the model failed to predict the 1702
stocks that also closed above BOP. That might appear to show
the model was a failure but in contrast, the model also
predicted 97% of stocks that fail to close above their BOP.
Overall, the model was about 96% correct.
So the takeaway is that about
4 in 5 stocks that are predicted to close above their BOP,
actually will close above their BOP.
How will you know the stocks
that the model predicts will close above BOP?
1. By filtering the cup and
handle watchlist
 2. By reading the Daily Report of
CwH Stocks Likely to Close above BoP at Next Session*
3. By looking at the alerts sent
to Platinum Subscribers
 4. On the Alerts Issued Today
page on the site, they are denoted with and asterisk.
 |
| List | Breakouts | Avg. Gain |
|---|---|---|
| CWH | 22 | 1.51 |
| SQZ | 45 | 3.73 |
| HTF | 4 | 5.67 |
| HSB | 0 | |
| DB | 0 |
| Brkout Date | Symbol | Base | Squeeze | Brkout Price | Brkout Day Close | RS Rank* | Last Close | Current % off BOP | Gain at Intraday High |
|---|---|---|---|---|---|---|---|---|---|
| 2021-11-01 | SI | CWH | n | 174.99 | 190.34 | 98 | 215.16 | 22.96% | 29.71% |
| 2021-11-02 | PLCE | SQZ | y | 85.64 | 91.06 | 92 | 99.48 | 16.16% | 23.12% |
| 2021-11-02 | IRIX | SQZ | y | 8.12 | 8.14 | 96 | 9.37 | 15.39% | 16.26% |
| 2021-11-01 | CAL | SQZ | y | 23.07 | 24.52 | 89 | 26.6 | 15.3% | 18.12% |
| 2021-11-03 | IRIX | SQZ | y | 8.15 | 8.69 | 96 | 9.37 | 14.97% | 15.83% |
| 2021-11-05 | ATOM | SQZ | y | 25.03 | 28.26 | 91 | 28.26 | 12.9% | 17.86% |
| 2021-11-01 | CCXI | HTF | n | 36.01 | 36.41 | 86 | 40.15 | 11.5% | 12.44% |
| 2021-11-01 | LEU | HTF | n | 57.80 | 60.55 | 99 | 64.2 | 11.07% | 37.13% |
| 2021-11-01 | GPRE | SQZ | y | 37.96 | 38.94 | 93 | 42.06 | 10.8% | 11.96% |
| 2021-11-01 | ERII | SQZ | y | 20.33 | 20.51 | 84 | 22.43 | 10.33% | 12.15% |
| 2021-11-01 | CATO | SQZ | y | 17.64 | 17.93 | 93 | 19.37 | 9.81% | 10.26% |
| 2021-11-03 | PLCE | SQZ | y | 91.07 | 98.29 | 93 | 99.48 | 9.23% | 15.78% |
| 2021-11-02 | XHR | SQZ | y | 18.44 | 18.48 | 82 | 20.12 | 9.11% | 10.68% |
| 2021-11-02 | HAYN | SQZ | y | 40.13 | 40.14 | 92 | 43.61 | 8.67% | 9% |
| 2021-11-02 | CAL | SQZ | y | 24.53 | 24.78 | 92 | 26.6 | 8.44% | 11.09% |
| 2021-11-02 | RHP | SQZ | y | 87.82 | 89.36 | 86 | 95.22 | 8.43% | 9.94% |
| 2021-11-05 | CNK | SQZ | y | 20.44 | 22.11 | 89 | 22.11 | 8.17% | 8.98% |
| 2021-11-02 | CATO | SQZ | y | 17.94 | 18.01 | 93 | 19.37 | 7.97% | 8.42% |
| 2021-11-03 | HAYN | CWH | n | 40.82 | 41.29 | 92 | 43.61 | 6.83% | 7.15% |
| 2021-11-01 | RIVE | CWH | y | 13.56 | 13.81 | 86 | 14.44 | 6.49% | 6.49% |
| 2021-11-03 | FRT | CWH | y | 125.07 | 128.46 | 81 | 132.56 | 5.99% | 8.38% |
| 2021-11-05 | GPRE | CWH | n | 40.00 | 42.06 | 93 | 42.06 | 5.15% | 6.25% |
| 2021-11-03 | CLI | CWH | y | 18.71 | 19.21 | 81 | 19.66 | 5.08% | 5.45% |
| 2021-11-02 | BW | SQZ | y | 7.14 | 7.21 | 87 | 7.5 | 5.04% | 5.46% |
| Symbol | Company | Industry | RS Rank | Last Close | BoP | % off BoP |
|---|---|---|---|---|---|---|
| PNRG | PrimeEnergy Resources Corporation | Oil & Gas E&P | 93 | 69.9 | 71.50 | 97.76 |
| MSON | MISONIX, Inc. | Medical Devices | 89 | 26.54 | 26.56 | 99.92 |
| CONN | Conn's, Inc. | Specialty Retail | 92 | 25.38 | 25.94 | 97.84 |
| UVSP | Univest Financial Corporation | Banks - Regional | 81 | 30.53 | 30.90 | 98.8 |
| *These stocks were selected using our CWH price breakout model. This model selects stocks likely to close above the breakout price at the next session. When backtested over the three years beginning January 2019 until October 28, 2021, 80% of the stocks selected closed above their breakout price. This does not mean that on any day, 80% of the stocks selected will breakout, but it is the expectation over an extended period of time. | ||||||
| Symbol | BO Price |
BO Vol. |
Company | Industry | RS Rank |
Last Close |
|---|---|---|---|---|---|---|
| MOSY | 6.86 | 1,077,713 | MoSys - Inc. | Semiconductors | 96 | 6.08 |
| PBF | 16.46 | 6,786,029 | PBF Energy Inc. | Oil & Gas Refining & Marketing | 94 | 14.70 |
| OII | 16.36 | 1,235,408 | Oceaneering International - Inc. | Oil & Gas Equipment & Services | 93 | 14.05 |
| GOSS | 14.30 | 827,224 | Gossamer Bio - Inc. | Biotechnology | 91 | 13.29 |
| GGAL | 12.15 | 1,498,738 | Grupo Financiero Galicia S.A. | Banks - Regional | 90 | 11.41 |
| PUMP | 10.80 | 1,269,607 | ProPetro Holding Corp. | Oil & Gas Equipment & Services | 88 | 9.60 |
| GLNG | 14.36 | 1,487,307 | Golar LNG Limited | Oil & Gas Midstream | 82 | 13.58 |
| These stocks meet our suggested screening factors
for our Cup and Handle Chart Pattern watchlist. See Revised Rules for Trading Cup and Handle Breakouts |
||||||
| Index | Value | Change Week | Change YTD | Trend1 |
|---|---|---|---|---|
| Dow | 36327.9 |
1.42% | 18.7% | Up |
| NASDAQ | 15971.6 |
3.05% | 23.93% | Up |
| S&P 500 | 4697.53 |
2% | 25.07% | Up |
|
1The Market Trend is derived from
our proprietary market model. The market model is described on
the site here.
2The site also shows industry rankings based on fundamentals, combined technical and fundamentals, and on price alone. The site also shows daily industry movements. |
||||
| 1 Week | 13 Weeks | 26 Weeks | Year-to-Date |
|---|---|---|---|
| NASDAQ Composite |
NASDAQ Composite 7.65 |
NASDAQ Composite 16.14 |
S&P 500 25.07 |
| 1 Week | 3 Weeks | 13 Weeks | 26 Weeks |
|---|---|---|---|
| Uranium |
Thermal Coal |
Luxury Goods |
Silver |
| Aerospace & Defense 0 |
Aerospace & Defense 0 |
Aerospace & Defense 0 |
Aerospace & Defense 0 |
| Charts of each industry rank and performance over 12 months are available on the site | |||
If you received this newsletter from a friend and you would like to receive it regularly please go to the BreakoutWatch.com site and you will then be able to register to receive the newsletter.
Copyright (c) 11/06/2021 Proactive Technologies, LLC dba
BreakoutWatch.com. All rights reserved.
" BreakoutWatch," the BreakoutWatch.com "eye" logo, and the slogan
"tomorrow's breakouts today" are service marks of Proactive Technologies
LLC. All other marks are the property of their respective owners, and
are used for descriptive purposes only.
BreakoutWatch is not affiliated with Investor's Business Daily or with Mr. William O'Neil. Our site, research and analysis is supported entirely by subscription and is free from advertising.