Breakoutwatch Weekly Summary 02/26/22
You are receiving this email because you are or were a
BreakoutWatch.com subscriber, or have subscribed to our weekly
newsletter. This newsletter summarizes the breakout events of the week
and provides additional guidance that does not fit into our daily
format. It is published each weekend.
Newsletter Archive: https://www.breakoutwatch.com/content/newsletters
| New Average True Range Breakout
Watchlist - See New Features After fears that sanctions on Russia after the invasion of Ukraine would have a catastrophic effect on the US economy receded, the markets made a strong turnaround on Thursday and the NASDAQ closed the week 1.1% higher. Sanctions were not imposed on Russia's oil and gas exports, which would have raised gas prices at the pump in the US and further exacerbated inflation. 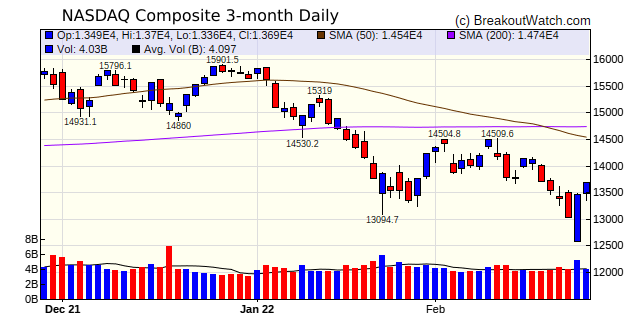 The top performing breakout this
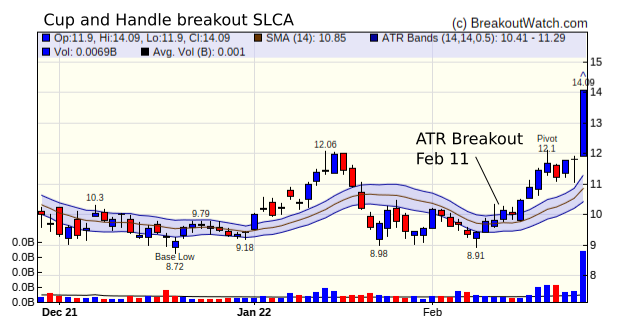
week was Silica Holdings Inc. (SLCA) with a 16.5% gain. Using
the new ATR breakout (see below) watchlist, this could have been
bought at the open on Feb. 14 for 10.1 for a gain of 40% up to
Friday's close.
 |
| Block Inc. (SQ) Block Inc. closed above its upper ATR channel on Friday following two days of well above average volume and an earnings report that beat analysts' estimates. Block is potentially starting a turnaround after a 60% fall from its September high. Block includes payments processor Square as one of its subsidiaries. Following the earnings report, management provided an optimistic outlook for future earnings. 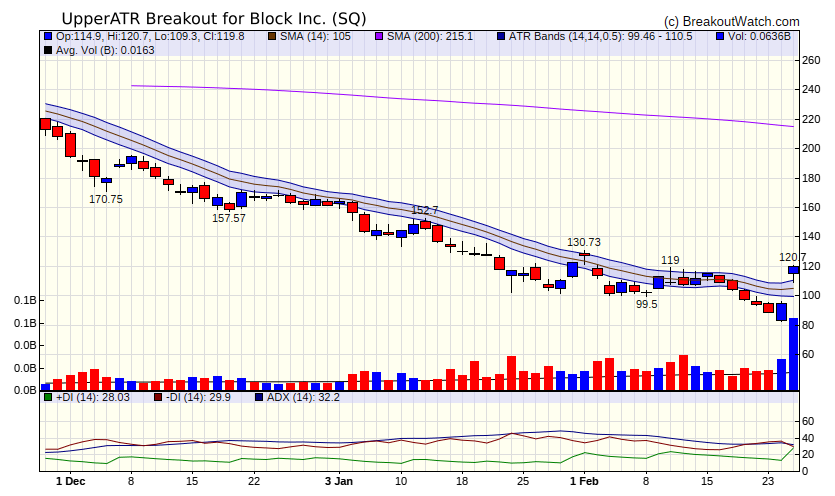 |
| Upper ATR Breakout Watchlist I developed this watchlist as a method of looking for stocks that have been beaten down and may be starting an upswing. It has proved profitable for me with several stocks, such as HRB and MRVI.The watchlist is accessed from the Long Position watchlist patterns menu. Average True Range (ATR) is a measure of the recent (in our case 14 day) volatility of a stock. In this watchlist we publish a list of stocks that have just broken out above their ATR. The 14 day ATR is viewable as a price band in our Technical Analysis Charts. The methodology is as follows: 1. Each day, calculate the 14
day ATR for all US stocks in our database with a close price
of $5.00 or more.
2. For the current day, calculate the upper value of the ATR range. If the current date is t then upperATRt = ATRt / 2 + SMAt where SMAt is the current 14 day simple moving average. 3. Calculate the equivalent upperATR for day t-1. 4. If closet > upperATRt and closet-1 < upperATRt-1 then we have an upperATR breakout candidate. 5. The ATR comparison date t to date t-1 tells us that volatility has increased beyond the average range, and also that the price has moved up but we don't know the strength of the upward trend. For that we turn to the Average Directional Indicator (ADX) and require that it be at least 25. To summarize, a stock is placed on the upper ATR breakout list when: close price is a minimum of
$5.00
50 day average volume is at least 1million Close price has moved above above the upper ATR band ADX is at least 25. 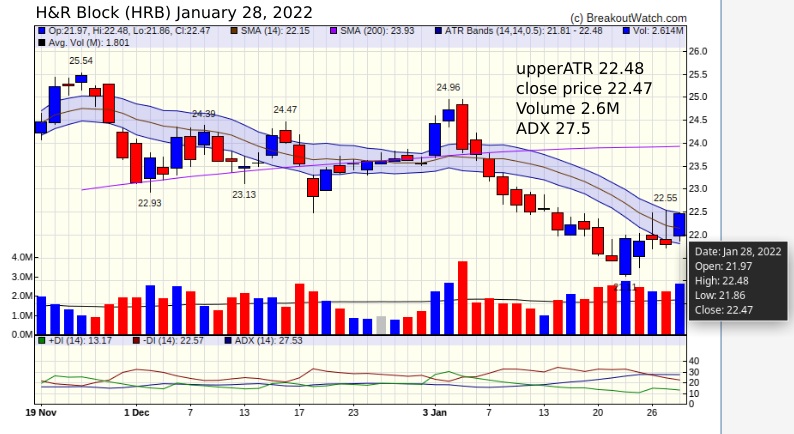 The next trading day, January31, HRB closed just above the upper ATR, and the conditions to be placed on the Upper ATR Breakout watchlist were met. 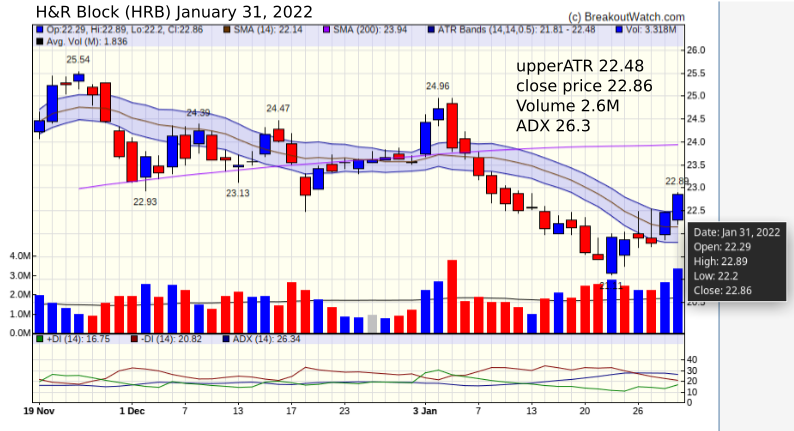 HRB could then have been bought at next open at $22.89. It went on to peak at 25.16 for a max. gain of 9.9%. 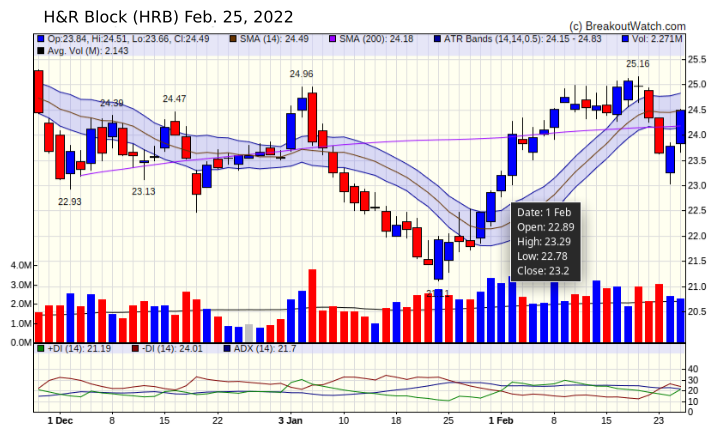 Important Note: Unlike our other watchlists, we do not send email alerts for stocks on this watchlist as they have already broken out when placed on the list. The list is available after all processing for the day is complete and will be included on the Daily Email. |
|
Our latest strategy
suggestions are here.
|
| List | Breakouts | Avg. Gain |
|---|---|---|
| CWH | 14 | 0.37 |
| SQZ | 28 | 2.55 |
| HTF | 1 | 12.46 |
| HSB | 0 | |
| DB | 0 |
| Brkout Date | Symbol | Base | Squeeze | Brkout Price | Brkout Day Close | RS Rank* | Last Close | Current % off BOP | Gain at Intraday High |
|---|---|---|---|---|---|---|---|---|---|
| 2022-02-25 | SLCA | CWH | n | 12.10 | 14.09 | 94 | 14.09 | 16.45% | 16.45% |
| 2022-02-23 | BPT | HTF | n | 10.59 | 11.03 | 99 | 11.91 | 12.46% | 19.07% |
| 2022-02-24 | MAYS | SQZ | y | 39.61 | 43.01 | 95 | 43.5 | 9.82% | 10.2% |
| 2022-02-25 | BRY | SQZ | y | 9.55 | 10.12 | 98 | 10.12 | 5.97% | 6.28% |
| 2022-02-25 | JILL | SQZ | y | 16.01 | 16.94 | 97 | 16.94 | 5.81% | 5.87% |
| 2022-02-24 | INSW | CWH | n | 17.07 | 17.61 | 81 | 17.96 | 5.21% | 5.39% |
| *RS Rank on day before breakout. | |||||||||
| Symbol | Company | Industry | RS Rank | Last Close | BoP | % off BoP |
|---|---|---|---|---|---|---|
| NVGS | Navigator Holdings Ltd. O | Oil & Gas Midstream | 89 | 10.27 | 10.45 | 98.28 |
| EVRI | Everi Holdings Inc. | Gambling | 93 | 23.92 | 24.23 | 98.72 |
| PNBK | Patriot National Bancorp Inc. | Banks - Regional | 98 | 16.4 | 16.58 | 98.91 |
| MRC | MRC Global Inc. | Oil & Gas Equipment & Services | 93 | 9.9 | 10.06 | 98.41 |
| LITE | Lumentum Holdings Inc. | Communication Equipment | 91 | 101.41 | 102.27 | 99.16 |
| *These stocks were selected using our CWH price breakout model. This model selects stocks likely to close above the breakout price at the next session. When backtested over the three years beginning January 2019 until October 28, 2021, 80% of the stocks selected closed above their breakout price. This does not mean that on any day, 80% of the stocks selected will breakout, but it is the expectation over an extended period of time. | ||||||
| Symbol | BO Price |
BO Vol. |
Company | Industry | RS Rank |
Last Close |
|---|---|---|---|---|---|---|
| BTU | 19.60 | 9,556,063 | Peabody Energy Corporation | Thermal Coal | 99 | 16.01 |
| MRC | 10.06 | 1,174,456 | MRC Global Inc. | Oil & Gas Equipment & Services | 93 | 9.90 |
| VALE | 18.15 | 46,897,037 | VALE S.A. American Depositary Shares Each Represe | Other Industrial Metals & Mining | 93 | 17.82 |
| SXC | 7.95 | 1,039,968 | SunCoke Energy - Inc. | Coking Coal | 92 | 7.83 |
| BHR | 6.50 | 759,085 | Braemar Hotels & Resorts Inc. | REIT - Hotel & Motel | 91 | 6.20 |
| BSM | 12.39 | 561,486 | Black Stone Minerals - L.P. | Oil & Gas E&P | 89 | 12.10 |
| VOD | 19.05 | 10,285,995 | Vodafone Group Plc | Telecom Services | 85 | 18.01 |
| KYN | 8.85 | 1,146,466 | Kayne Anderson Energy Infrastructure Fund - Inc. | Asset Management | 84 | 8.42 |
| INN | 10.58 | 877,080 | Summit Hotel Properties - Inc. | REIT - Hotel & Motel | 83 | 10.06 |
| XHR | 19.46 | 854,055 | Xenia Hotels & Resorts - Inc. | REIT - Hotel & Motel | 83 | 18.65 |
| These stocks meet our suggested screening factors
for our Cup and Handle Chart Pattern watchlist. See Revised Rules for Trading Cup and Handle Breakouts |
||||||
| Index | Value | Change Week | Change YTD | Trend1 |
|---|---|---|---|---|
| Dow | 34058.8 |
-0.06% | -6.27% | Down |
| NASDAQ | 13694.6 |
1.08% | -12.47% | Down |
| S&P 500 | 4384.65 |
0.82% | -8% | Down |
|
1The Market Trend is derived from
our proprietary market model. The market model is described on
the site here.
2The site also shows industry rankings based on fundamentals, combined technical and fundamentals, and on price alone. The site also shows daily industry movements. |
||||
| 1 Week | 13 Weeks | 26 Weeks | Year-to-Date |
|---|---|---|---|
| NASDAQ Composite |
Dow Jones -4.57 |
S&P 500 -2.76 |
Dow Jones -6.27 |
| 1 Week | 3 Weeks | 13 Weeks | 26 Weeks |
|---|---|---|---|
| Oil & Gas Drilling |
Oil & Gas Integrated |
REIT - Residential |
Solar |
| Aerospace & Defense 0 |
Aerospace & Defense 0 |
Aerospace & Defense 0 |
Aerospace & Defense 0 |
| Charts of each industry rank and performance over 12 months are available on the site | |||
If you received this newsletter from a friend and you would like to receive it regularly please go to the BreakoutWatch.com site and you will then be able to register to receive the newsletter.
Copyright (c) 02/26/2022 Proactive Technologies, LLC dba
BreakoutWatch.com. All rights reserved.
" BreakoutWatch," the BreakoutWatch.com "eye" logo, and the slogan
"tomorrow's breakouts today" are service marks of Proactive Technologies
LLC. All other marks are the property of their respective owners, and
are used for descriptive purposes only.
BreakoutWatch is not affiliated with Investor's Business Daily or with Mr. William O'Neil. Our site, research and analysis is supported entirely by subscription and is free from advertising.