Breakoutwatch Weekly Summary 04/02/22
You are receiving this email because you are or were a
BreakoutWatch.com subscriber, or have subscribed to our weekly
newsletter. This newsletter summarizes the breakout events of the week
and provides additional guidance that does not fit into our daily
format. It is published each weekend.
Newsletter Archive: https://www.breakoutwatch.com/content/newsletters
| NASDAQ Doji Shows Indecision Fueled
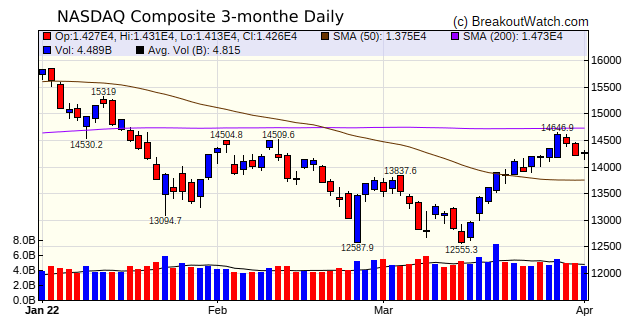
by Yield Inversion The NASDAQ started the week well as cease fire talks looked promising and then faded as progress proved ephemeral. Friday's price action ended with the candlestick showing a Doji pattern indicating indecision among market participants despite Friday's excellent jobs report. Complicating matters was Thursday's yield inversion between 2 year and 10 year Treasury Rates which is thought to indicate a recession is on the horizon. The markets are trying to make sense of increasing inflation, rising interest rates, a seemingly strong economy and fears of world war III.  |
Milestone
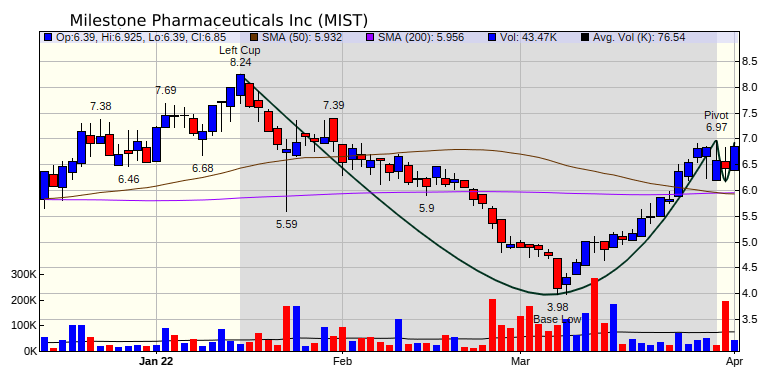
Pharmaceuticals Inc. (MIST) has shown considerable
strength in the last month and set the pivot on a cup and handle
pattern on Wednesday. Profit taking followed but on Friday the
stock rose almost back to the pivot showing the support shown
over the last month is still active. |
| No new features this week |
|
Our latest strategy
suggestions are here.
|
| List | Breakouts | Avg. Gain |
|---|---|---|
| CWH | 25 | 2.04 |
| SQZ | 40 | 1.52 |
| HTF | 1 | 0.14 |
| HSB | 0 | |
| DB | 0 |
| Brkout Date | Symbol | Base | Squeeze | Brkout Price | Brkout Day Close | RS Rank* | Last Close | Current % off BOP | Gain at Intraday High |
|---|---|---|---|---|---|---|---|---|---|
| 2022-03-28 | RCMT | CWH | n | 8.78 | 8.9 | 96 | 10.95 | 24.72% | 27.88% |
| 2022-03-30 | LAC | CWH | n | 35.68 | 36.86 | 98 | 38.94 | 9.14% | 12.5% |
| 2022-03-30 | BLU | SQZ | y | 6.60 | 6.7 | 94 | 7.2 | 9.09% | 9.55% |
| 2022-04-01 | HAYN | CWH | n | 44.87 | 48.8 | 90 | 48.8 | 8.76% | 9.51% |
| 2022-03-31 | XENE | SQZ | y | 30.13 | 30.57 | 96 | 32.36 | 7.4% | 7.77% |
| 2022-04-01 | XENE | SQZ | y | 30.58 | 32.36 | 96 | 32.36 | 5.82% | 6.18% |
| 2022-03-31 | CYTK | SQZ | y | 36.54 | 36.81 | 91 | 38.38 | 5.04% | 5.36% |
| *RS Rank on day before breakout. | |||||||||
| Symbol | Company | Industry | RS Rank | Last Close | BoP | % off BoP |
|---|---|---|---|---|---|---|
| RNDB | Randolph Bancorp, Inc. | Banks - Regional | 91 | 26.44 | 26.56 | 99.55 |
| MIST | Milestone Pharmaceuticals Inc. | Biotechnology | 87 | 6.85 | 6.97 | 98.28 |
| JAZZ | Jazz Pharmaceuticals plc | Biotechnology | 86 | 158.9 | 162.76 | 97.63 |
| CVCY | Central Valley Community Bancorp | Banks - Regional | 88 | 23.56 | 23.99 | 98.21 |
| *These stocks were selected using our CWH price breakout model. This model selects stocks likely to close above the breakout price at the next session. When backtested over the three years beginning January 2019 until October 28, 2021, 80% of the stocks selected closed above their breakout price. This does not mean that on any day, 80% of the stocks selected will breakout, but it is the expectation over an extended period of time. | ||||||
| Symbol | BO Price |
BO Vol. |
Company | Industry | RS Rank |
Last Close |
|---|---|---|---|---|---|---|
| DNOW | 11.50 | 1,325,393 | NOW Inc. | Oil & Gas Equipment & Services | 93 | 11.34 |
| MBI | 16.68 | 662,017 | MBIA Inc. | Insurance - Specialty | 93 | 15.95 |
| OII | 18.20 | 1,366,596 | Oceaneering International - Inc. | Oil & Gas Equipment & Services | 91 | 15.55 |
| FPI | 14.22 | 726,998 | Farmland Partners Inc. | REIT - Specialty | 89 | 14.02 |
| SILV | 10.13 | 1,229,565 | SilverCrest Metals Inc. | Other Industrial Metals & Mining | 89 | 9.26 |
| SA | 19.90 | 560,638 | Seabridge Gold - Inc. | Gold | 88 | 18.98 |
| LPG | 15.02 | 639,532 | Dorian LPG Ltd. | Oil & Gas Midstream | 87 | 14.74 |
| ACRE | 15.74 | 794,147 | Ares Commercial Real Estate Corporation | REIT - Mortgage | 84 | 15.73 |
| RPT | 14.12 | 716,066 | RPT Realty | REIT - Retail | 83 | 14.01 |
| AG | 14.49 | 9,384,445 | First Majestic Silver Cor | Silver | 82 | 13.58 |
| These stocks meet our suggested screening factors
for our Cup and Handle Chart Pattern watchlist. See Revised Rules for Trading Cup and Handle Breakouts |
||||||
| Index | Value | Change Week | Change YTD | Trend1 |
|---|---|---|---|---|
| Dow | 34818.3 |
-0.12% | -4.18% | Up |
| NASDAQ | 14261.5 |
0.65% | -8.84% | Up |
| S&P 500 | 4545.86 |
0.06% | -4.62% | Up |
|
1The Market Trend is derived from
our proprietary market model. The market model is described on
the site here.
2The site also shows industry rankings based on fundamentals, combined technical and fundamentals, and on price alone. The site also shows daily industry movements. |
||||
| 1 Week | 13 Weeks | 26 Weeks | Year-to-Date |
|---|---|---|---|
| NASDAQ Composite |
Dow Jones -4.62 |
S&P 500 4.33 |
Dow Jones -4.18 |
| 1 Week | 3 Weeks | 13 Weeks | 26 Weeks |
|---|---|---|---|
| Thermal Coal |
Oil & Gas Integrated |
Thermal Coal |
Home Improvement Retail |
| Aerospace & Defense 0 |
Aerospace & Defense 0 |
Aerospace & Defense 0 |
Aerospace & Defense 0 |
| Charts of each industry rank and performance over 12 months are available on the site | |||
If you received this newsletter from a friend and you would like to receive it regularly please go to the BreakoutWatch.com site and you will then be able to register to receive the newsletter.
Copyright (c) 04/02/2022 Proactive Technologies, LLC dba
BreakoutWatch.com. All rights reserved.
" BreakoutWatch," the BreakoutWatch.com "eye" logo, and the slogan
"tomorrow's breakouts today" are service marks of Proactive Technologies
LLC. All other marks are the property of their respective owners, and
are used for descriptive purposes only.
BreakoutWatch is not affiliated with Investor's Business Daily or with Mr. William O'Neil. Our site, research and analysis is supported entirely by subscription and is free from advertising.