Breakoutwatch Weekly Summary 06/11/22
You are receiving this email because you are or were a
BreakoutWatch.com subscriber, or have subscribed to our weekly
newsletter. This newsletter summarizes the breakout events of the week
and provides additional guidance that does not fit into our daily
format. It is published each weekend.
Newsletter Archive: https://www.breakoutwatch.com/content/newsletters
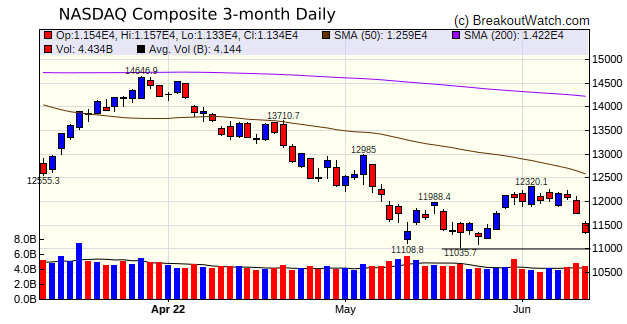
| NASDAQ will Test Support Next Week The NASDAQ lost 5.6% this week and is approaching the support level of May 2. The week started well but by Wednesday, fears that the CPI report due Friday would show that inflation was not abating sparked selling and sure enough, the report that inflation in May had reached 8.6% year-on-year provoked a broad based selloff that hit every sector, including energy. There is now the distinct possibility that the Fed will need to tighten more aggressively, provoking a recession.  The positive start to the week
produced 95 breakouts, 25 from a cup and handle pattern, but
just 2 managed to hold on to a minimum 5% gain by week's end.
|
| IMAX Corp.
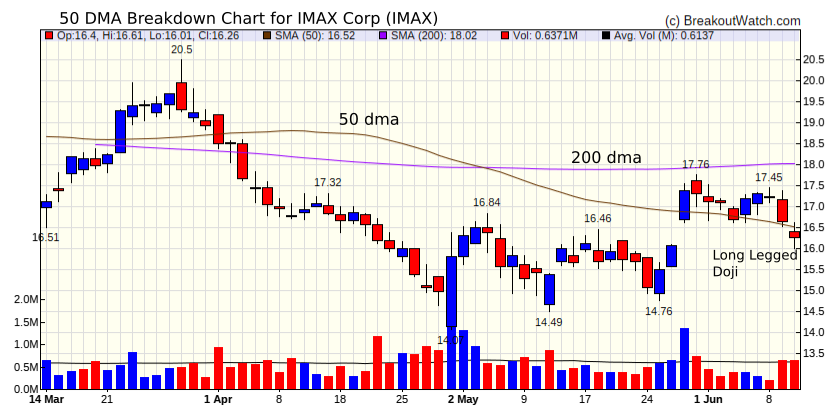
(IMAX) IMAX has risen in recent days due to the box office success of Top Gun: Maverick and the anticipated success of the new Jurassic Park sequel, but 2 big down days and Friday's Long Legged Doji, which implies directional uncertainty, indicates investors fear the Summer's profits may not be so strong as families trade off entertainment for gas, food and rent.  |
| No new features this week |
|
Our latest strategy
suggestions are here.
|
| List | Breakouts | Avg. Gain |
|---|---|---|
| CWH | 25 | -4.35 |
| SQZ | 70 | -4.37 |
| HTF | 0 | |
| HSB | 0 | |
| DB | 0 |
| Brkout Date | Symbol | Base | Squeeze | Brkout Price | Brkout Day Close | RS Rank* | Last Close | Current % off BOP | Gain at Intraday High |
|---|---|---|---|---|---|---|---|---|---|
| 2022-06-07 | METC | SQZ | y | 15.02 | 17.68 | 96 | 17.34 | 15.45% | 21.44% |
| 2022-06-06 | WLL | CWH | n | 93.74 | 95.11 | 96 | 99.25 | 5.88% | 8.43% |
| *RS Rank on day before breakout. | |||||||||
| Symbol | Company | Industry | RS Rank | Last Close | BoP | % off BoP |
|---|---|---|---|---|---|---|
| RNDB | Randolph Bancorp, Inc. | Banks - Regional | 95 | 26.19 | 26.63 | 98.35 |
| SRLP | Sprague Resources LP | Oil & Gas Refining & Marketing | 90 | 19.01 | 19.03 | 99.89 |
| HQY | HealthEquity, Inc. | Health Information Services | 93 | 64.05 | 66.11 | 96.88 |
| MVO | MV Oil Trust Units of Ben | Oil & Gas E&P | 97 | 12.36 | 12.66 | 97.63 |
| JILL | J. Jill, Inc. | Apparel Retail | 93 | 18.75 | 19.47 | 96.3 |
| ATNI | ATN International, Inc. | Telecom Services | 91 | 43.65 | 45.43 | 96.08 |
| VIPS | Vipshop Holdings Limited | Internet Retail | 89 | 10.56 | 11.20 | 94.29 |
| MBI | MBIA Inc. | Insurance - Specialty | 94 | 13.99 | 14.48 | 96.62 |
| *These stocks were selected using our CWH price breakout model. This model selects stocks likely to close above the breakout price at the next session. When backtested over the three years beginning January 2019 until October 28, 2021, 80% of the stocks selected closed above their breakout price. This does not mean that on any day, 80% of the stocks selected will breakout, but it is the expectation over an extended period of time. | ||||||
| Symbol | BO Price |
BO Vol. |
Company | Industry | RS Rank |
Last Close |
|---|---|---|---|---|---|---|
| VIST | 10.03 | 955,297 | Vista Energy S.A.B. de C. | Oil & Gas E&P | 98 | 8.68 |
| TUFN | 12.85 | 1,228,829 | Tufin Software Technologi | Software - Infrastructure | 96 | 12.26 |
| NPTN | 15.63 | 946,878 | NeoPhotonics Corporation | Semiconductors | 95 | 15.55 |
| CTT | 12.39 | 708,487 | CatchMark Timber Trust - Inc. | REIT - Specialty | 94 | 10.99 |
| OIS | 9.02 | 1,075,796 | Oil States International - Inc. | Oil & Gas Equipment & Services | 94 | 7.79 |
| WTTR | 9.69 | 534,649 | Select Energy Services - Inc. | Oil & Gas Equipment & Services | 94 | 8.50 |
| CNSL | 8.49 | 713,949 | Consolidated Communications Holdings - Inc. | Telecom Services | 93 | 7.97 |
| MRC | 12.05 | 948,208 | MRC Global Inc. | Oil & Gas Equipment & Services | 93 | 10.86 |
| RFP | 17.11 | 1,175,095 | Resolute Forest Products Inc. | Paper & Paper Products | 93 | 15.06 |
| KYN | 9.83 | 1,158,003 | Kayne Anderson Energy Infrastructure Fund - Inc. | Asset Management | 92 | 9.39 |
| These stocks meet our suggested screening factors
for our Cup and Handle Chart Pattern watchlist. See Revised Rules for Trading Cup and Handle Breakouts |
||||||
| Index | Value | Change Week | Change YTD | Trend1 |
|---|---|---|---|---|
| Dow | 31392.8 |
-4.58% | -13.61% | Down |
| NASDAQ | 11340 |
-5.6% | -27.52% | Down |
| S&P 500 | 3900.86 |
-5.05% | -18.16% | Down |
|
1The Market Trend is derived from
our proprietary market model. The market model is described on
the site here.
2The site also shows industry rankings based on fundamentals, combined technical and fundamentals, and on price alone. The site also shows daily industry movements. |
||||
| 1 Week | 13 Weeks | 26 Weeks | Year-to-Date |
|---|---|---|---|
| Dow Jones |
Dow Jones -4.71 |
Dow Jones -12.73 |
Dow Jones -13.61 |
| 1 Week | 3 Weeks | 13 Weeks | 26 Weeks |
|---|---|---|---|
| Thermal Coal |
Thermal Coal |
REIT - Residential |
Solar |
| Aerospace & Defense 0 |
Aerospace & Defense 0 |
Aerospace & Defense 0 |
Aerospace & Defense 0 |
| Charts of each industry rank and performance over 12 months are available on the site | |||
If you received this newsletter from a friend and you would like to receive it regularly please go to the BreakoutWatch.com site and you will then be able to register to receive the newsletter.
Copyright (c) 06/11/2022 Proactive Technologies, LLC dba
BreakoutWatch.com. All rights reserved.
" BreakoutWatch," the BreakoutWatch.com "eye" logo, and the slogan
"tomorrow's breakouts today" are service marks of Proactive Technologies
LLC. All other marks are the property of their respective owners, and
are used for descriptive purposes only.
BreakoutWatch is not affiliated with Investor's Business Daily or with Mr. William O'Neil. Our site, research and analysis is supported entirely by subscription and is free from advertising.