Breakoutwatch Weekly Summary 02/26/2023
You are receiving this email because you are or were a
BreakoutWatch.com subscriber, or have subscribed to our weekly
newsletter.
To read this newsletter on the site, click here: Newsletter
.
Contents
Market Summary
Stocks suffer biggest decline in 10 weeks
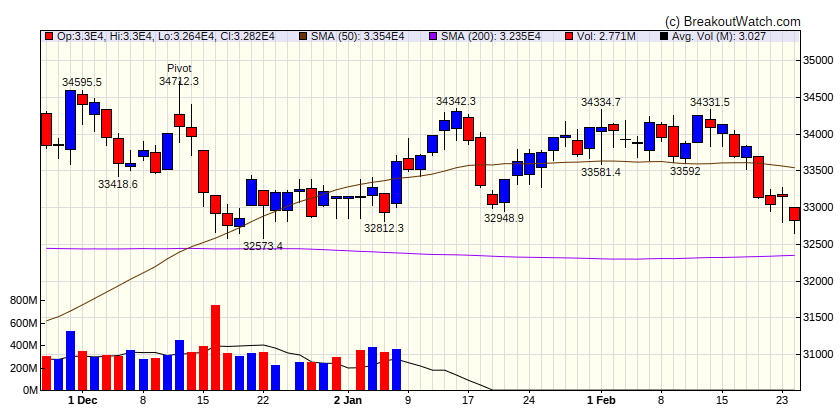
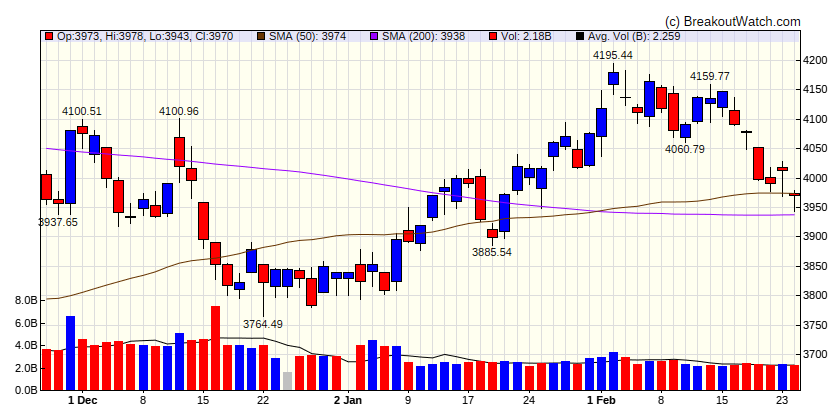
A cascade of upside inflation and growth surprises pushed the S&P 500 Index to its worst weekly loss since early December. At its close on Friday, the index had surrendered roughly 35% of the rally that began in October, but it remained up 3.40% for the year to date. The declines pushed the narrowly focused Dow Jones Industrial Average into negative territory for 2023, however. Communication services and consumer discretionary stocks performed worst within the S&P 500, but the declines were widespread, and growth stocks fell only modestly more than value shares. [more...]
Major Index Performance
| Dow Jones | |
|---|---|
| Last Close | 32816.9 |
| Wk. Gain | -2.62 % |
| Yr. Gain | -0.92 % |
| Trend | Down |

|
|
| S&P 500 | |
|---|---|
| Last Close | 3970.04 |
| Wk. Gain | -2.03 % |
| Yr. Gain | 3.68 % |
| Trend | Down |

|
|
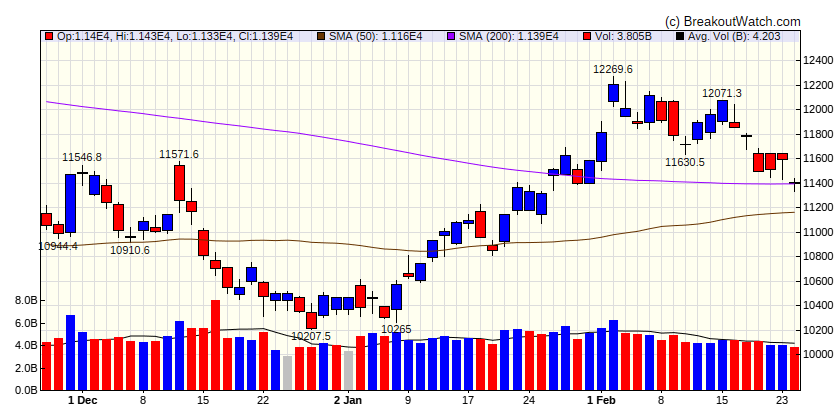
| NASDAQ Comp. | |
|---|---|
| Last Close | 11394.9 |
| Wk. Gain | -2.11 % |
| Yr. Gain | 9.9 % |
| Trend | Down |

|
|
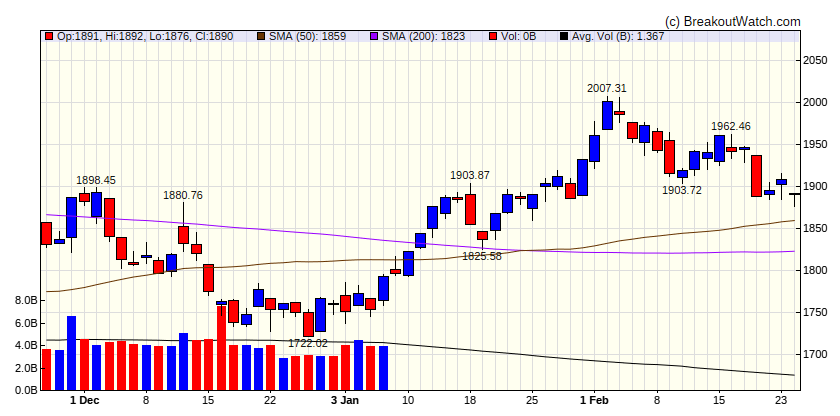
| Russell 2000 | |
|---|---|
| Last Close | 1890.49 |
| Wk. Gain | -2.4 % |
| Yr. Gain | 6.82 % |
| Trend | Down |

|
|
Performance by Sector
| Sector | Wk. Change % | Yr. Change % | Trend |
|---|---|---|---|
| Consumer Discretionary | -2.54 | 12.61 | Down |
| Consumer Staples | -0.8 | -1.62 | Up |
| Energy | 0.92 | -1.59 | Down |
| Finance | -1.12 | 5.87 | Down |
| Health Care | -2.14 | -4.31 | Down |
| Industrials | -1.89 | 4.66 | Down |
| Technology | -1.32 | 10.97 | Down |
| Materials | -0.2 | 5.54 | Down |
| REIT | -3.27 | 3.92 | Down |
| Telecom | -2.96 | 11.59 | Down |
| Utilities | -2.06 | -6.04 | Down |
Breakouts This Week Still Within 5% of Breakout Price (Limit 20 top C Score)
| Watchlist | Symbol | Company | Industry | C Score* | % Gain |
|---|---|---|---|---|---|
| SQZ | VTRU | Vitru Limited | Education & Training Services | 83.3 % | 1.3 % |
| SQZ | BLD | TopBuild Corp. | Engineering & Construction | 81.5 % | 0.5 % |
| SQZ | HPK | HighPeak Energy, Inc. | Oil & Gas E&P | 81.3 % | 0.4 % |
| SQZ | NETI | Eneti Inc. | Marine Shipping | 80.8 % | 1 % |
| CWH | HUBB | Hubbell Inc | Electrical Equipment & Parts | 79.9 % | 0.2 % |
| SQZ | HURN | Huron Consulting Group Inc. | Consulting Services | 77 % | 0.1 % |
| SQZ | TRGP | Targa Resources, Inc. | Oil & Gas Midstream | 74.1 % | 0.3 % |
| SQZ | STVN | Stevanato Group S.p.A. Or | Medical Instruments & Supplies | 73 % | 3.7 % |
| SQZ | CGBD | Carlyle Secured Lending, Inc. | Asset Management | 72.5 % | 0.3 % |
| SQZ | UNM | Unum Group | Insurance - Life | 72.4 % | 1.6 % |
| CWH | EVH | Evolent Health, Inc | Health Information Services | 72.2 % | 1.8 % |
| CWH | PWR | Quanta Services, Inc. | Engineering & Construction | 71.4 % | 1.3 % |
| SQZ | CNO | CNO Financial Group, Inc. | Insurance - Life | 69.6 % | 2 % |
| CWH | FTAI | FTAI Aviation Ltd. | Rental & Leasing Services | 69.5 % | 1.9 % |
| SQZ | NVGS | Navigator Holdings Ltd. O | Oil & Gas Midstream | 66.8 % | 1.6 % |
| SQZ | TGS | Transportadora de Gas del Sur SA TGS | Oil & Gas Integrated | 65.5 % | 2.9 % |
| SQZ | VOXX | VOXX International Corporation | Consumer Electronics | 58.5 % | 1.5 % |
| SQZ | SGML | Sigma Lithium Corporation | Other Industrial Metals & Mining | 58.2 % | 2 % |
| *C score is our assessment of a Stock's correlation to CAN SLIM principles. It combines a stock's Technical and Fundamental merits and is expressed as a percentage. | |||||
Breakdowns within 5% of Breakdown Price
| Watchlist | Symbol | Company | Industry | C Score* | % Loss |
|---|---|---|---|---|---|
| SS | HDSN | Hudson Technologies, Inc. | Specialty Chemicals | 78.8 % | -2.3 % |
| SS | CFFI | C&F Financial Corporation | Banks - Regional | 73.5 % | -0 % |
| SS | ARLP | Alliance Resource Partners, L.P. | Thermal Coal | 72 % | -2.9 % |
| SS | MCRI | Monarch Casino & Resort, Inc. | Resorts & Casinos | 70 % | -2 % |
| SS | NPO | EnPro Industries Inc | Specialty Industrial Machinery | 68.3 % | -3.2 % |
| SS | WES | Western Midstream Partners, LP | Oil & Gas Midstream | 67.1 % | -2.5 % |
| SS | AXL | American Axle & Manufacturing Holdings, Inc. | Auto Parts | 66.9 % | -0.7 % |
| SS | SRPT | Sarepta Therapeutics, Inc. | Biotechnology | 64.9 % | -1 % |
| SS | TMUS | T-Mobile US, Inc. | Telecom Services | 64.8 % | -0.1 % |
| SS | WMT | Walmart Inc. | Discount Stores | 63.8 % | -0.9 % |
| SS | LKFN | Lakeland Financial Corporation | Banks - Regional | 62.9 % | -1.4 % |
| SS | GES | Guess?, Inc. | Apparel Retail | 60.9 % | -2.3 % |
| SS | NWBI | Northwest Bancshares, Inc. | Banks - Regional | 59.4 % | -1.4 % |
| SS | CORT | Corcept Therapeutics Inco | Biotechnology | 59.3 % | -2.8 % |
| SS | CDRE | Cadre Holdings, Inc. | Aerospace & Defense | 52 % | -0.7 % |
| SS | CTKB | Cytek Biosciences, Inc. | Medical Devices | 50.4 % | -1.2 % |
| SS | SMR | NuScale Power Corporation Class A | Specialty Industrial Machinery | 46.8 % | -3.3 % |
| SS | CHPT | ChargePoint Holdings, Inc. | Specialty Retail | 36.5 % | -3.9 % |
| *C score is our assessment of a Stock's correlation to CAN SLIM principles. It combines a stock's Technical and Fundamental merits and is expressed as a percentage. | |||||
Cup and Handle Stocks Likely to Breakout at Next Session
| Symbol | BoP | Company | Industry | Within x% of BoP | C Score* | |
|---|---|---|---|---|---|---|
| There were no CWH stocks meeting our breakout model criteria | ||||||
| *C score is our assessment of a Stock's correlation to CAN SLIM principles. It combines a stock's Technical and Fundamental merits and is expressed as a percentage. | ||||||
Cup and Handle Chart of the Week
I could not find any cup and handle charts worth proposing this week.