Breakoutwatch Weekly Summary 03/05/2023
You are receiving this email because you are or were a
BreakoutWatch.com subscriber, or have subscribed to our weekly
newsletter.
To read this newsletter on the site, click here: Newsletter
.
Contents
Market Summary
Stocks regain lost ground
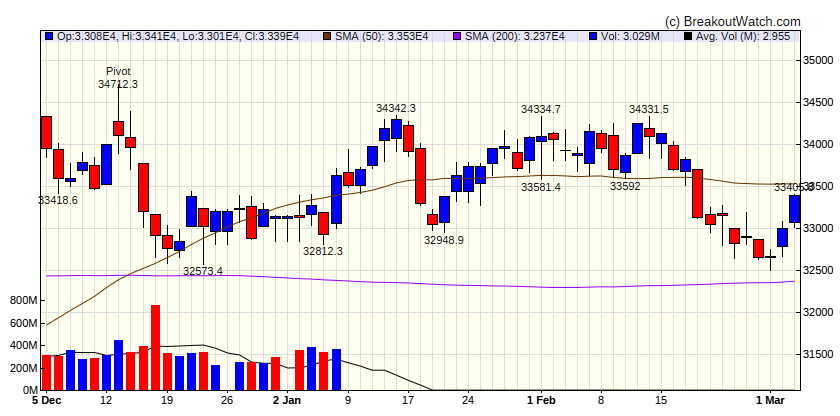
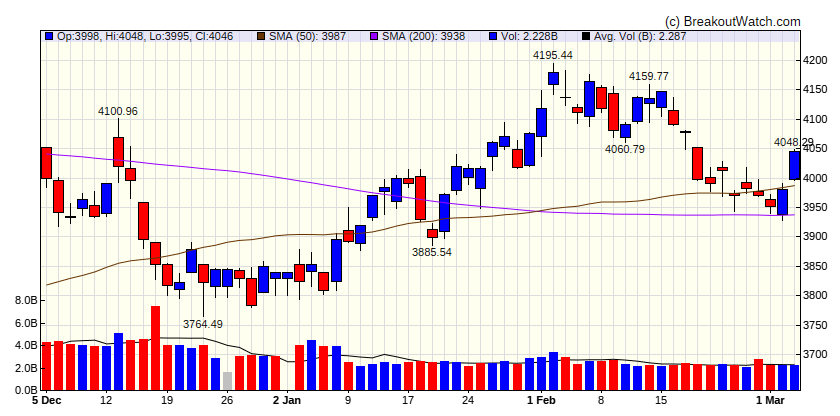
Stocks closed higher and regained some ground following their worst weekly decline in two months. Energy and materials shares were especially strong, while communication services were helped by a gain in Facebook parent Meta Platforms. Utilities stocks lagged. According to T. Rowe Price traders, a lack of notable catalysts seemed to result in low market volumes throughout much of the week. Sentiment also appeared to gain support from the S&P 500 Index staying above its 200-day moving average, a metric commonly followed by technical analysts and traders. [more...]
Major Index Performance
| Dow Jones | |
|---|---|
| Last Close | 33391 |
| Wk. Gain | 1.47 % |
| Yr. Gain | 0.81 % |
| Trend | Down |

|
|
| S&P 500 | |
|---|---|
| Last Close | 4045.64 |
| Wk. Gain | 1.33 % |
| Yr. Gain | 5.66 % |
| Trend | Down |

|
|
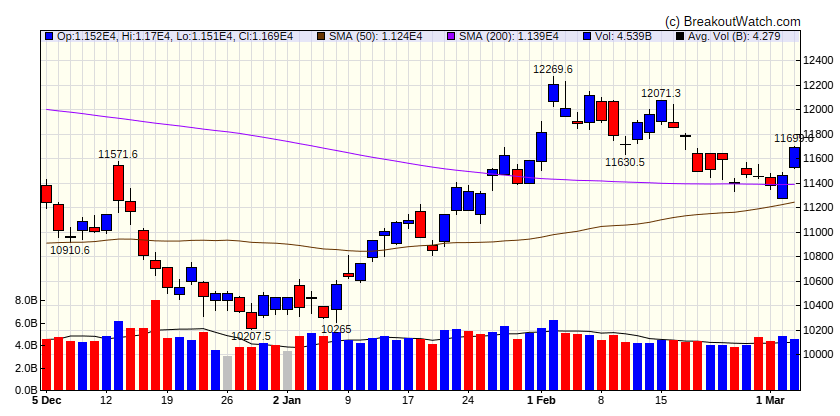
| NASDAQ Comp. | |
|---|---|
| Last Close | 11689 |
| Wk. Gain | 1.49 % |
| Yr. Gain | 12.74 % |
| Trend | Down |

|
|
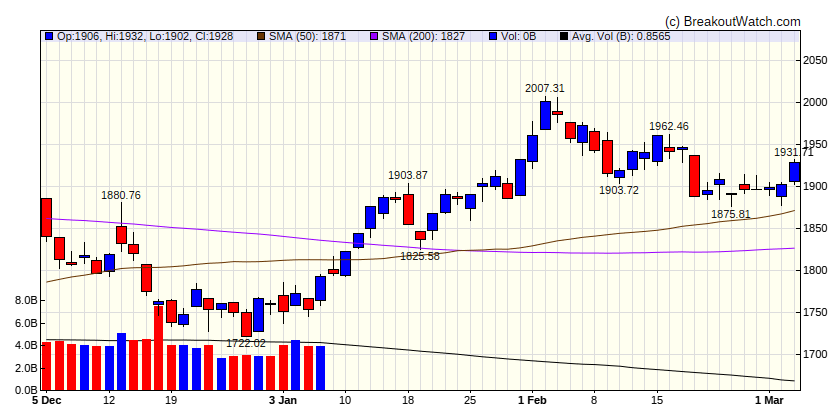
| Russell 2000 | |
|---|---|
| Last Close | 1928.26 |
| Wk. Gain | 1.38 % |
| Yr. Gain | 8.96 % |
| Trend | Down |

|
|
Performance by Sector
| Sector | Wk. Change % | Yr. Change % | Trend |
|---|---|---|---|
| Consumer Discretionary | 0.68 | 14.53 | Down |
| Consumer Staples | -0.62 | -1.8 | Down |
| Energy | 3.25 | 1.75 | Down |
| Finance | 0 | 6.59 | Down |
| Health Care | 0.37 | -3.42 | Down |
| Industrials | 2.12 | 8.05 | Down |
| Technology | 1.83 | 14.14 | Down |
| Materials | 3.99 | 10.33 | Up |
| REIT | 0.45 | 5.4 | Down |
| Telecom | 1.74 | 14.25 | Down |
| Utilities | -1.08 | -6.62 | Down |
Breakouts This Week Still Within 5% of Breakout Price (Limit 20 top C Score)
| Watchlist | Symbol | Company | Industry | C Score* | % Gain |
|---|---|---|---|---|---|
| CWH | SXC | SunCoke Energy, Inc. | Coking Coal | 85.2 % | 4.8 % |
| SQZ | UAL | United Airlines Holdings, Inc. | Airlines | 84.8 % | 1.3 % |
| SQZ | VTRU | Vitru Limited | Education & Training Services | 84.5 % | 3.5 % |
| CWH | PR | Permian Resources Corporation Class A | Oil & Gas E&P | 82.5 % | 3.3 % |
| SQZ | NETI | Eneti Inc. | Marine Shipping | 81.6 % | 3.9 % |
| CWH | ELA | Envela Corporation | Luxury Goods | 81 % | 2.4 % |
| SQZ | ASLE | AerSale Corporation | Airports & Air Services | 80.4 % | 4.3 % |
| SQZ | PBT | Permian Basin Royalty Trust | Oil & Gas Midstream | 80.2 % | 1 % |
| SQZ | BGI | Birks Group Inc. | Luxury Goods | 79.6 % | 2.2 % |
| CWH | UFPT | UFP Technologies, Inc. | Medical Devices | 79.4 % | 2.6 % |
| SQZ | MRTN | Marten Transport, Ltd. | Trucking | 79 % | 0.4 % |
| SQZ | VMI | Valmont Industries, Inc. | Conglomerates | 78.5 % | 2.6 % |
| CWH | KEX | Kirby Corporation | Marine Shipping | 78 % | 1.4 % |
| SQZ | BLD | TopBuild Corp. | Engineering & Construction | 78 % | 2.1 % |
| SQZ | TTC | Toro Company (The) | Tools & Accessories | 78 % | 3.1 % |
| CWH | LSI | Life Storage, Inc. | REIT - Industrial | 77.6 % | 1.2 % |
| SQZ | IMMR | Immersion Corporation | Software - Application | 77.2 % | 1.3 % |
| SQZ | CVLG | Covenant Logistics Group, Inc. | Trucking | 76.9 % | 2 % |
| SQZ | MTR | Mesa Royalty Trust | Oil & Gas E&P | 76.9 % | 2.4 % |
| SQZ | MANH | Manhattan Associates, Inc. | Software - Application | 76.8 % | 2.3 % |
| *C score is our assessment of a Stock's correlation to CAN SLIM principles. It combines a stock's Technical and Fundamental merits and is expressed as a percentage. | |||||
Breakdowns within 5% of Breakdown Price
| Watchlist | Symbol | Company | Industry | C Score* | % Loss |
|---|---|---|---|---|---|
| SS | MRK | Merck & Company, Inc. | Drug Manufacturers - General | 77.4 % | -2.2 % |
| SS | GPC | Genuine Parts Company | Specialty Retail | 73.9 % | -0 % |
| SS | BBSI | Barrett Business Services, Inc. | Staffing & Employment Services | 68.6 % | -4.4 % |
| SS | MCRI | Monarch Casino & Resort, Inc. | Resorts & Casinos | 66.8 % | -3.4 % |
| SS | TTI | Tetra Technologies, Inc. | Oil & Gas Equipment & Services | 61 % | -3.2 % |
| SS | ATO | Atmos Energy Corporation | Utilities - Regulated Gas | 60.8 % | -1.9 % |
| SS | KDP | Keurig Dr Pepper Inc. | Beverages - Non-Alcoholic | 48.2 % | -2.8 % |
| SS | RVLP | RVL Pharmaceuticals plc | Biotechnology | 42.5 % | -5 % |
| SS | EIGR | Eiger BioPharmaceuticals, Inc. | Biotechnology | 33.9 % | -1.8 % |
| *C score is our assessment of a Stock's correlation to CAN SLIM principles. It combines a stock's Technical and Fundamental merits and is expressed as a percentage. | |||||
Cup and Handle Stocks Likely to Breakout at Next Session
| Symbol | BoP | Company | Industry | Within x% of BoP | C Score* | |
|---|---|---|---|---|---|---|
| There were no CWH stocks meeting our breakout model criteria | ||||||
| *C score is our assessment of a Stock's correlation to CAN SLIM principles. It combines a stock's Technical and Fundamental merits and is expressed as a percentage. | ||||||
Cup and Handle Chart of the Week
I could not find any cup and handle charts worth proposing this week.