Breakoutwatch Weekly Summary 06/18/2023
You are receiving this email because you are or were a
BreakoutWatch.com subscriber, or have subscribed to our weekly
newsletter.
To read this newsletter on the site, click here: Newsletter
.
The daily update for Friday, June 16, did not complete and I attmpted to rerun it today. As a result, you may have received some emails for June 17. Please ignore them. Normal service should be resumed by Tuesday, June 20.
Market Summary
Rally continues on calming inflation fears
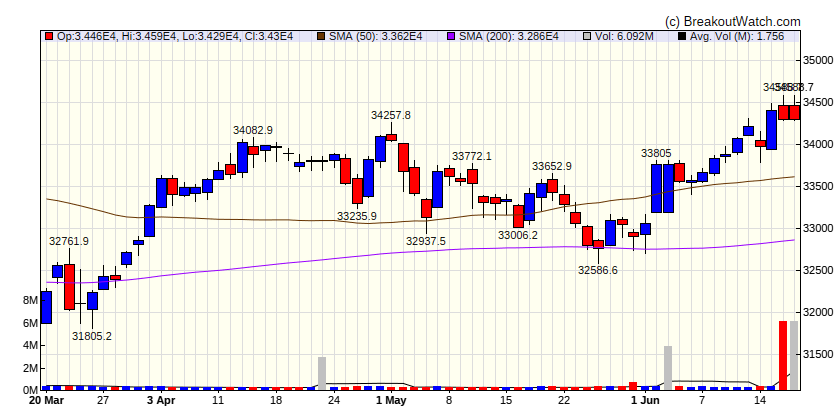
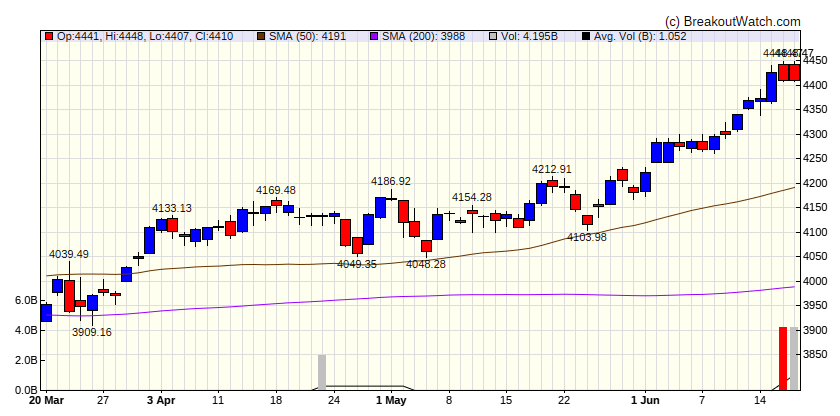
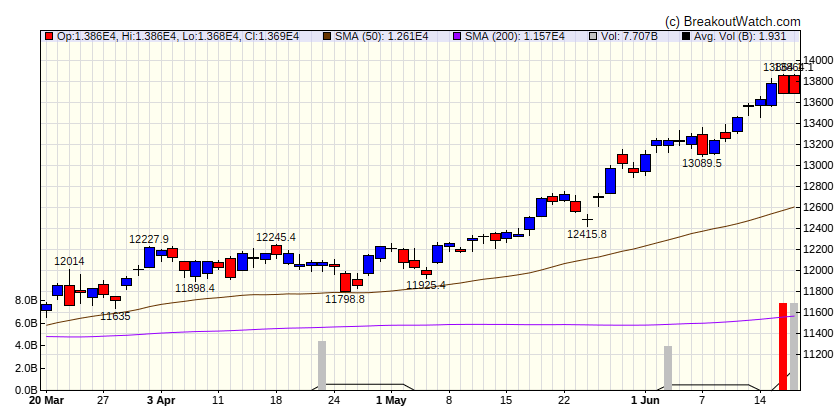
Favorable inflation and growth signals appeared to help stocks continue a rally that began with only a few interruptions in late May. The S&P 500 Index notched its longest stretch of daily gains since November 2021 and its best weekly performance since the end of March. The market’s advanced narrowed a bit, however, as reflected in the renewed outperformance of growth stocks and large-caps. Markets were scheduled to be closed the following Monday in observance of the Juneteenth holiday. [more...]
Major Index Performance
| Dow Jones
|
| Last Close
| 34299.1 |
| Wk. Gain
| 1.16 % |
| Yr. Gain
| 3.56 % |
| Trend
| Up |

|
| S&P 500
|
| Last Close
| 4409.59 |
| Wk. Gain
| 2.35 % |
| Yr. Gain
| 15.16 % |
| Trend
| Up |

|
| NASDAQ Comp.
|
| Last Close
| 13689.6 |
| Wk. Gain
| 2.73 % |
| Yr. Gain
| 32.03 % |
| Trend
| Up |

|
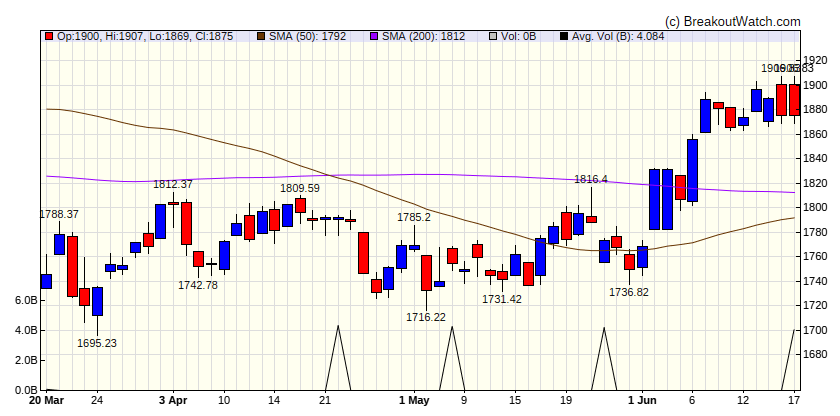
| Russell 2000
|
| Last Close
| 1875.47 |
| Wk. Gain
| 0.47 % |
| Yr. Gain
| 5.97 % |
| Trend
| Up |

|
Performance by Sector
| Sector |
Wk. Change % |
Yr. Change % |
Trend |
| Consumer Discretionary |
-77.65 |
-71.85 |
Up |
| Consumer Staples |
-68.52 |
-69.24 |
Down |
| Energy |
-21.96 |
16.46 |
Up |
| Finance |
-14.86 |
-20.07 |
Up |
| Health Care |
-68.22 |
-63.74 |
Down |
| Industrials |
-57.62 |
-57.62 |
Up |
| Technology |
-72.07 |
-72.07 |
Up |
| Materials |
-50.77 |
-50.77 |
Up |
| REIT |
-34.3 |
-34.3 |
Up |
| Telecom |
-29.82 |
-29.82 |
Up |
| Utilities |
-56.62 |
-56.62 |
Down |
Breakouts This Week Still Within 5% of Breakout Price (Limit 20 top C Score)
| Watchlist |
Symbol |
Company |
Industry |
C Score* |
% Gain |
| SQZ |
AER |
AerCap Holdings N.V. Ordi |
Rental & Leasing Services |
66.9 % |
1.2 % |
| *C score is our assessment of a Stock's correlation to CAN SLIM principles. It combines a stock's Technical and Fundamental merits and is expressed as a percentage. |
Breakdowns within 5% of Breakdown Price
| Watchlist |
Symbol |
Company |
Industry |
C Score* |
% Loss |
There were no Breakdowns still within 5% of breakdown price this week |
| *C score is our assessment of a Stock's correlation to CAN SLIM principles. It combines a stock's Technical and Fundamental merits and is expressed as a percentage. |


