Breakoutwatch Weekly Summary 08/21/2023
You are receiving this email because you are or were a
BreakoutWatch.com subscriber, or have subscribed to our weekly
newsletter.
To read this newsletter on the site, click here: Newsletter
.
The newsletter has been absent for a few weeks as I have concentrated on correcting some data problems introduced by a hack of the database. I believe all stock data is now correct and watchlist filters are working again. Next week I depart for 4 weeks on a European vacation but will try to produce this newsletter remotely.
Market Summary
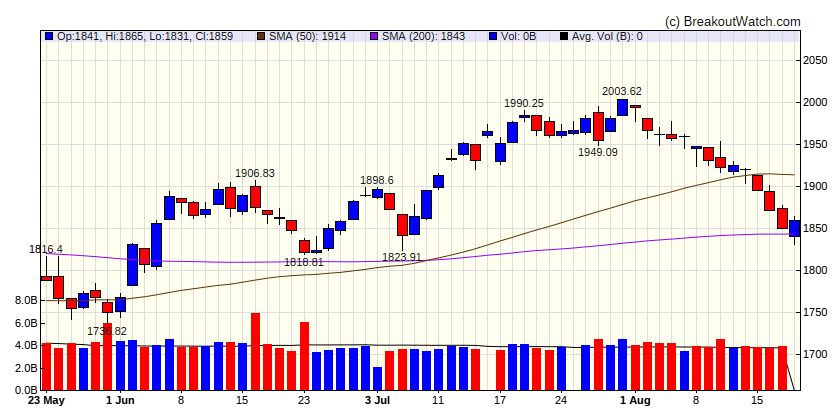
Stocks retreat for third consecutive week
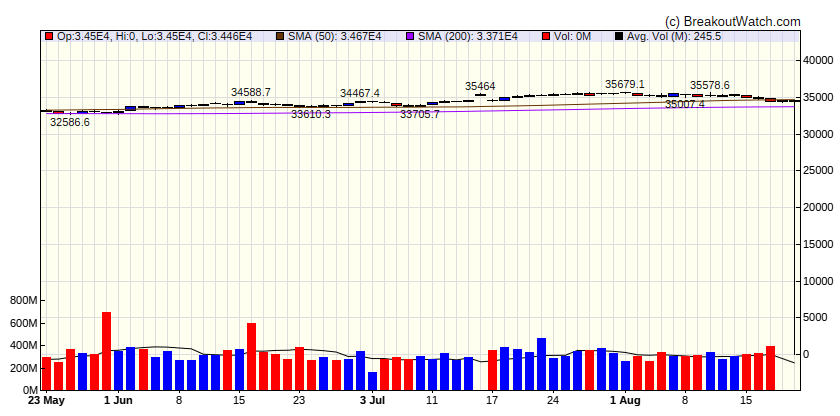
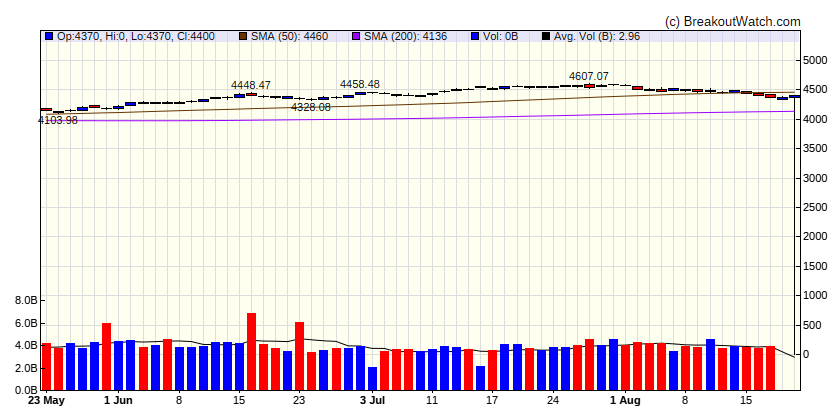
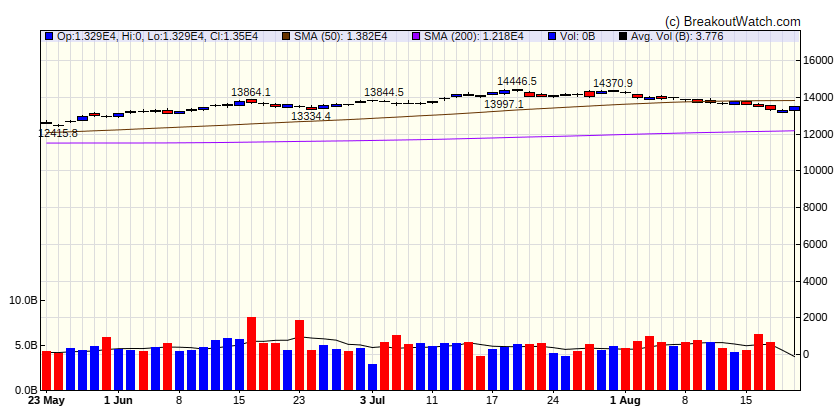
Stocks were broadly lower as sentiment appeared to take a blow from a sharp increase in longer-term bond yields and fears of a sharp slowdown in China (see below). The S&P 500 Index ended the week down 5.15% from its July 26 intraday peak. Growth shares should theoretically suffer the most as rising rates place a greater discount on future earnings, but the Russell 1000 Growth Index held up modestly better than its value counterpart. Small-cap stocks performed the worst. T. Rowe Price traders noted that program trading, technical factors, and thin summer trading volumes may have accentuated the market’s swings. [more...]
Major Index Performance
| Dow Jones
|
| Last Close
| |
| Wk. Gain
| -100 % |
| Yr. Gain
| -100 % |
| Trend
| Down |
|
| S&P 500
|
| Last Close
| |
| Wk. Gain
| -100 % |
| Yr. Gain
| -100 % |
| Trend
| Down |
|
| NASDAQ Comp.
|
| Last Close
| |
| Wk. Gain
| -100 % |
| Yr. Gain
| -100 % |
| Trend
| Down |
|
| Russell 2000
|
| Last Close
| |
| Wk. Gain
| -100 % |
| Yr. Gain
| -100 % |
| Trend
| Down |
|
Performance by Sector
| Sector |
Wk. Change % |
Yr. Change % |
Trend |
| Consumer Discretionary |
-1.79 |
27.44 |
Down |
| Consumer Staples |
-1.8 |
-0.54 |
Down |
| Energy |
0.77 |
3.15 |
Up |
| Finance |
-0.62 |
-0.28 |
Down |
| Health Care |
-1.28 |
-1.28 |
Down |
| Industrials |
-1.31 |
11.32 |
Down |
| Technology |
0.05 |
34.39 |
Down |
| Materials |
-0.75 |
4.38 |
Down |
| REIT |
-2.7 |
-3.37 |
Down |
| Telecom |
-2.08 |
30.65 |
Down |
| Utilities |
-0.47 |
-11.85 |
Down |
Breakouts This Week Still Within 5% of Breakout Price (Limit 20 top C Score)
| Watchlist |
Symbol |
Company |
Industry |
C Score* |
% Gain |
| *C score is our assessment of a Stock's correlation to CAN SLIM principles. It combines a stock's Technical and Fundamental merits and is expressed as a percentage. |
Breakdowns within 5% of Breakdown Price
| Watchlist |
Symbol |
Company |
Industry |
C Score* |
% Loss |
| SS |
RDNT |
RadNet, Inc. |
|
70 % |
-4.2 % |
| SS |
MDLZ |
Mondelez International, Inc. |
Confectioners |
67.3 % |
-3.6 % |
| SS |
SQSP |
Squarespace, Inc. |
|
66.2 % |
-1.4 % |
| SS |
TOST |
Toast, Inc. |
|
62.8 % |
-1.8 % |
| SS |
TWO |
Two Harbors Investment Co |
Banks - Global |
62.8 % |
-2.9 % |
| SS |
SPRB |
Spruce Biosciences, Inc. |
Biotechnology |
62 % |
-1.8 % |
| SS |
ALOT |
AstroNova, Inc. |
Computer Hardware |
59.6 % |
-0.9 % |
| SS |
CASS |
Cass Information Systems, Inc |
|
59.1 % |
-1.3 % |
| SS |
ARHS |
Arhaus, Inc. |
Home Improvement Retail |
57.7 % |
-2.6 % |
| SS |
VPG |
Vishay Precision Group, Inc. |
Financial Conglomerates |
56.5 % |
-4.2 % |
| SS |
MGNX |
MacroGenics, Inc. |
|
52.8 % |
-1.2 % |
| SS |
FET |
Forum Energy Technologies, Inc. |
Industrial Distribution |
48.6 % |
-4.8 % |
| SS |
SUP |
Superior Industries International, Inc. |
|
43.9 % |
-4.9 % |
| *C score is our assessment of a Stock's correlation to CAN SLIM principles. It combines a stock's Technical and Fundamental merits and is expressed as a percentage. |
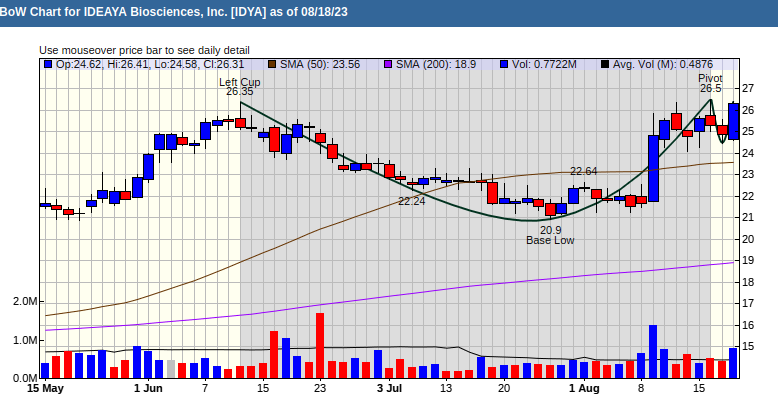
Cup and Handle Chart of the Week
Aug. 16, 2023 /PRNewswire/ -- IDEAYA Biosciences, Inc. (Nasdaq: IDYA), a precision medicine oncology company committed to the discovery and development of targeted therapeutics, announced the achievement of First-Patient-In for the company-sponsored Phase 2 clinical trial evaluating darovasertib as neoadjuvant and adjuvant therapy in primary uveal melanoma (UM) patients.
