Breakoutwatch Weekly Summary 11/15/2023
You are receiving this email because you are or were a
BreakoutWatch.com subscriber, or have subscribed to our weekly
newsletter.
To read this newsletter on the site, click here: Newsletter
.
Market Summary
Stocks’ winning streak comes to an end
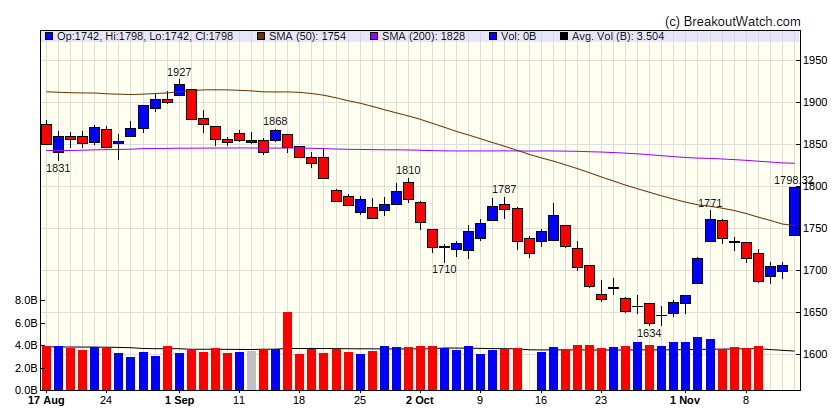
The major indexes finished mixed for the week, but not before the S&P 500 Index came close to matching its longest winning streak in nearly two decades—on Wednesday, the S&P 500 notched its eighth straight gain, while the Nasdaq Composite Index marked its ninth. The market’s strength was exceptionally narrow, however, with an equally weighted version of the S&P 500 Index lagging its market-weighted counterpart by 190 basis points (1.90)%, and the Russell 1000 Value Index trailing its growth counterpart by 404 basis points—the largest margin since March. [more...]
Major Index Performance
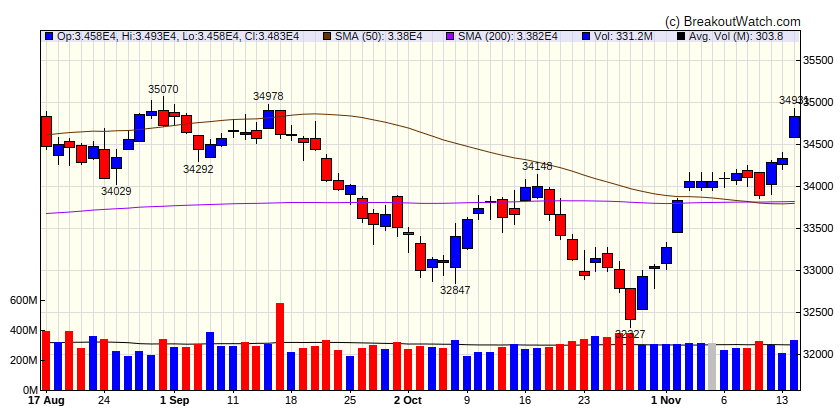
| Dow Jones
|
| Last Close
| 34827.7 |
| Wk. Gain
| 1.94 % |
| Yr. Gain
| 5.06 % |
| Trend
| Up |
|
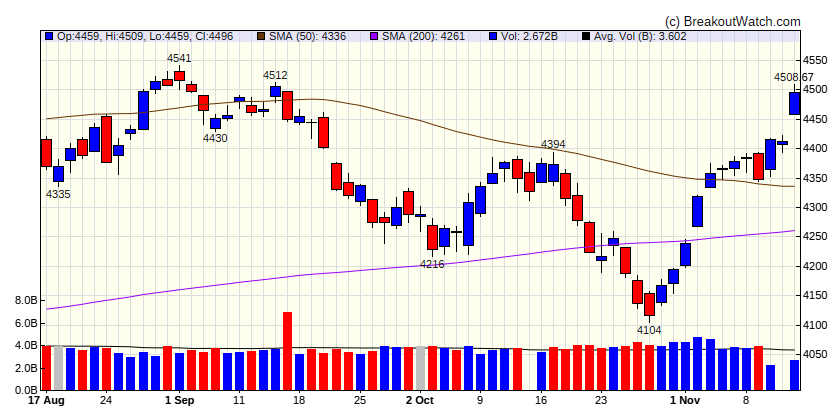
| S&P 500
|
| Last Close
| 4495.7 |
| Wk. Gain
| 2.37 % |
| Yr. Gain
| 16.68 % |
| Trend
| Up |
|
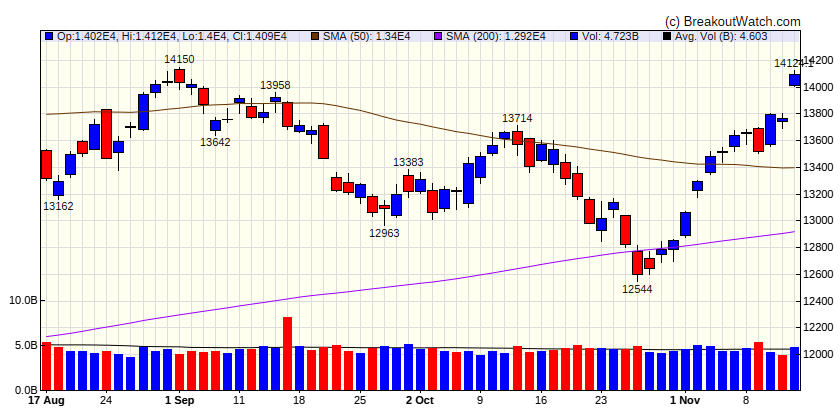
| NASDAQ Comp.
|
| Last Close
| 14094.4 |
| Wk. Gain
| 2.93 % |
| Yr. Gain
| 33.44 % |
| Trend
| Up |
|
| Russell 2000
|
| Last Close
| 1798.32 |
| Wk. Gain
| 4.51 % |
| Yr. Gain
| 1.6 % |
| Trend
| Up |
|
Performance by Sector
| Sector |
Wk. Change % |
Yr. Change % |
Trend |
| Consumer Discretionary |
3.69 |
29.18 |
Up |
| Consumer Staples |
1.56 |
-3.67 |
Up |
| Energy |
1.95 |
-0.58 |
Down |
| Finance |
2.59 |
1.52 |
Up |
| Health Care |
0.2 |
-6.13 |
Down |
| Industrials |
3.47 |
10.46 |
Up |
| Technology |
3.63 |
43.62 |
Up |
| Materials |
2.98 |
2.67 |
Up |
| REIT |
3.63 |
-4.07 |
Up |
| Telecom |
2.14 |
37.03 |
Up |
| Utilities |
1.86 |
-13.72 |
Up |
Breakouts This Week Still Within 5% of Breakout Price (Limit 20 top C Score)
| Watchlist |
Symbol |
Company |
Industry |
C Score* |
% Gain |
| SQZ |
WFRD |
Weatherford International plc |
Software - Application |
89.6 % |
4 % |
| SQZ |
FUTU |
Futu Holdings Limited |
Capital Markets |
85.6 % |
4.8 % |
| CWH |
RYAAY |
Ryanair Holdings plc |
Airlines |
81.9 % |
2.2 % |
| CWH |
BXSL |
Blackstone Secured Lending Fund |
Asset Management |
80.3 % |
0.6 % |
| SQZ |
IHG |
Intercontinental Hotels G |
Lodging |
79.8 % |
3.1 % |
| CWH |
FMX |
Fomento Economico Mexicano S.A.B. de C.V. |
Beverages - Brewers |
79.4 % |
0.4 % |
| SQZ |
STNG |
Scorpio Tankers Inc. |
Software - Infrastructure |
79 % |
1.8 % |
| CWH |
SKT |
Tanger Factory Outlet Centers, Inc. |
REIT - Retail |
78.3 % |
2.8 % |
| CWH |
MBWM |
Mercantile Bank Corporation |
Banks - Regional |
78 % |
4.5 % |
| SQZ |
BMI |
Badger Meter, Inc. |
Biotechnology |
78 % |
4 % |
| SQZ |
SP |
SP Plus Corporation |
Specialty Business Services |
77.7 % |
0.7 % |
| CWH |
ITT |
ITT Inc. |
Specialty Industrial Machinery |
77.3 % |
4.5 % |
| CWH |
AMZN |
Amazon.com, Inc. |
Internet Retail |
77.2 % |
1.7 % |
| CWH |
PH |
Parke |
Specialty Industrial Machinery |
76.7 % |
1.4 % |
| CWH |
BLX |
Banco Latinoamericano de |
Banks - Regional |
76.6 % |
3 % |
| CWH |
PLTR |
Palantir Technologies Inc. |
Software - Infrastructure |
76.4 % |
4 % |
| CWH |
MBIN |
Merchants Bancorp |
Banks - Regional |
76.3 % |
0.7 % |
| CWH |
TJX |
TJX Companies, Inc. |
Apparel Retail |
74.8 % |
0.9 % |
| CWH |
TNC |
Tennant Company |
Specialty Industrial Machinery |
74.6 % |
0.1 % |
| CWH |
WAB |
Westinghouse Air Brake Technologies Corporation |
Railroads |
74.5 % |
3 % |
| *C score is our assessment of a Stock's correlation to CAN SLIM principles. It combines a stock's Technical and Fundamental merits and is expressed as a percentage. |
Breakdowns within 5% of Breakdown Price
| Watchlist |
Symbol |
Company |
Industry |
C Score* |
% Loss |
| SS |
AVDL |
Avadel Pharmaceuticals plc |
Agricultural Inputs |
53.7 % |
-1.8 % |
| *C score is our assessment of a Stock's correlation to CAN SLIM principles. It combines a stock's Technical and Fundamental merits and is expressed as a percentage. |
| There were no CWH stocks meeting our breakout model criteria |
| *C score is our assessment of a Stock's correlation to CAN SLIM principles. It combines a stock's Technical and Fundamental merits and is expressed as a percentage. |
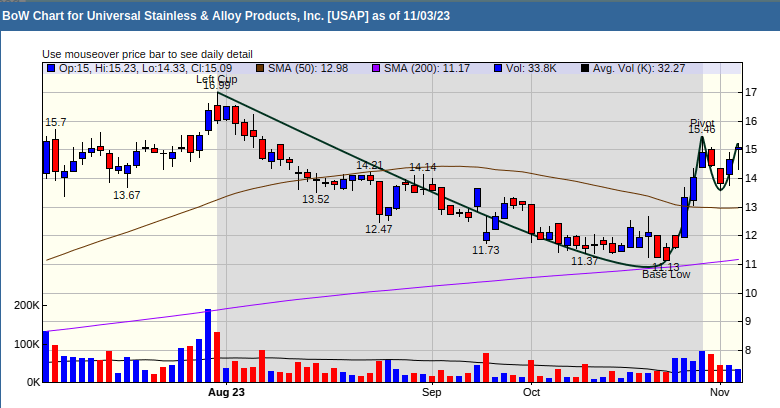
Cup and Handle Chart of the Week
Of the 4 stocks I selected as most likely to breakout in the coming week, USAP appears to be the best positioned. The chart shows strong accumulation in the right side of the cup, followed by profit taking, and then further accumulation in the handle in the handle. For an analysis of how and why a cup and handle pattern forms, see our tutorial Anatomy of a Cup-with-Handle Chart Pattern
