Breakoutwatch Weekly Summary 12/17/2023
You are receiving this email because you are or were a
BreakoutWatch.com subscriber, or have subscribed to our weekly
newsletter.
To read this newsletter on the site, click here: Newsletter
.
Contents
Market Summary
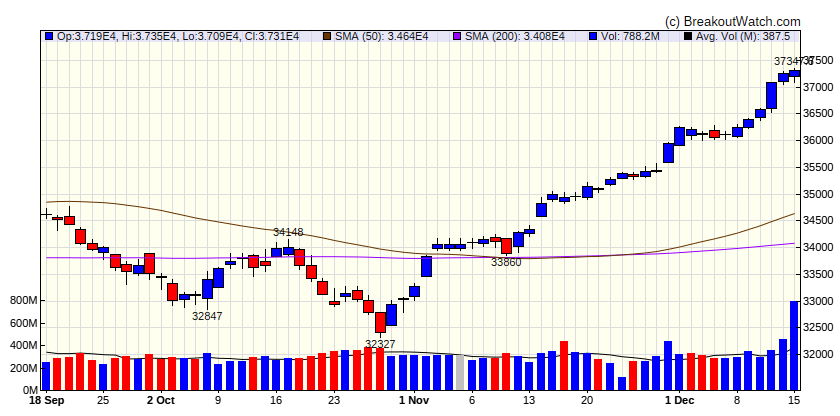
Dow hits record high in broad advance
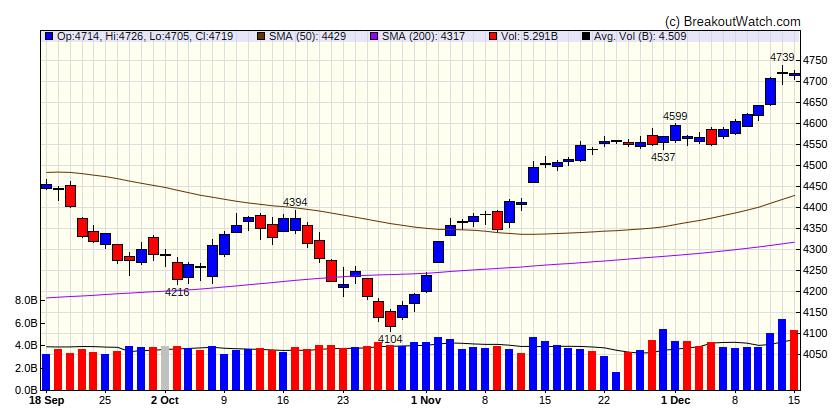
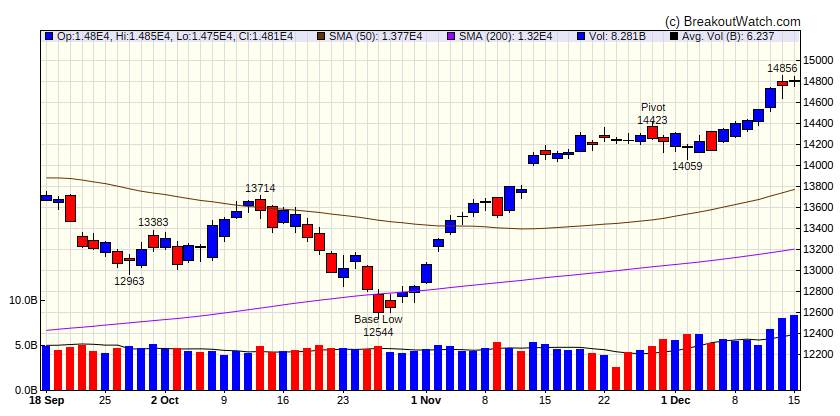
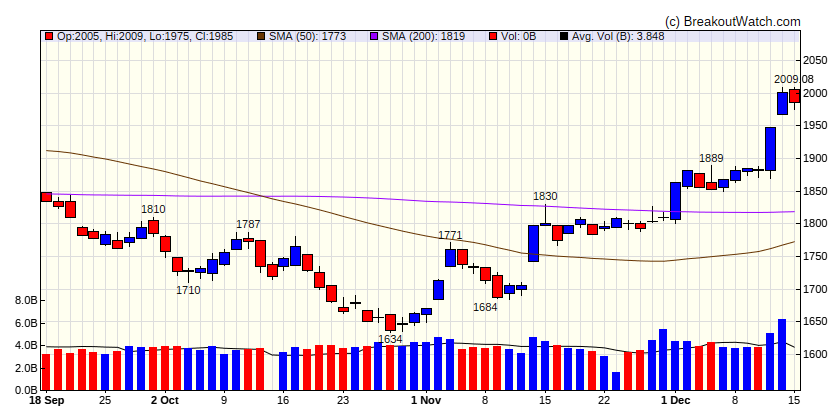
The S&P 500 Index, Nasdaq Composite, and Dow Jones Industrial Average recorded their seventh consecutive week of gains—the longest streak for the S&P 500 since 2017, according to Reuters. The gains lifted the first two benchmarks to 52-week highs and the Dow to an all-time record. Continuing a recent pattern, the week’s gains were also broadly based. An equally weighted index of S&P 500 stocks outpaced its market-weighted counterpart by 131 basis points (1.31 percentage points). Small-caps also outperformed, and the 5.55% surge in the Russell 2000 Index lifted it out of bear market territory (down 20% or more) for the first time in over 20 months. [more...]
Major Index Performance
| Dow Jones | |
|---|---|
| Last Close | 37305.2 |
| Wk. Gain | 2.9 % |
| Yr. Gain | 12.54 % |
| Trend | Up |
|
|
| S&P 500 | |
|---|---|
| Last Close | 4719.19 |
| Wk. Gain | 2.75 % |
| Yr. Gain | 22.48 % |
| Trend | Up |
|
|
| NASDAQ Comp. | |
|---|---|
| Last Close | 14813.9 |
| Wk. Gain | 3.3 % |
| Yr. Gain | 40.26 % |
| Trend | Up |
|
|
| Russell 2000 | |
|---|---|
| Last Close | 1985.13 |
| Wk. Gain | 5.59 % |
| Yr. Gain | 12.15 % |
| Trend | Up |
|
|
Performance by Sector
| Sector | Wk. Change % | Yr. Change % | Trend |
|---|---|---|---|
| Consumer Discretionary | 3.96 | 39.72 | Up |
| Consumer Staples | 1.22 | -1.57 | Up |
| Energy | 2.4 | -1.72 | Down |
| Finance | 3.84 | 11.11 | Up |
| Health Care | 1.67 | -0.75 | Up |
| Industrials | 3.84 | 19.75 | Up |
| Technology | 3.48 | 52.49 | Up |
| Materials | 4.32 | 10.3 | Up |
| REIT | 5.9 | 7.03 | Up |
| Telecom | 1.39 | 41.02 | Up |
| Utilities | 1.42 | -10.75 | Up |
Breakouts This Week Still Within 5% of Breakout Price (Limit 20 top C Score)
| Watchlist | Symbol | Company | Industry | C Score* | % Gain |
|---|---|---|---|---|---|
| SQZ | POWL | Powell Industries, Inc. | Semiconductors | 88.5 % | 2.9 % |
| CWH | WAB | Westinghouse Air Brake Technologies Corporation | Railroads | 83.1 % | 1.3 % |
| SQZ | XP | XP Inc. | Capital Markets | 82.7 % | 3.8 % |
| CWH | AGM | Federal Agricultural Mortgage Corporation | Credit Services | 81.7 % | 1.8 % |
| CWH | CCL | Carnival Corporation | Travel Services | 80.1 % | 2.6 % |
| SQZ | FOUR | Shift4 Payments, Inc. | Software - Infrastructure | 79.8 % | 4 % |
| SQZ | ETN | Eaton Corporation, PLC Or | Specialty Industrial Machinery | 79.7 % | 1.2 % |
| SQZ | TNC | Tennant Company | Specialty Industrial Machinery | 79.1 % | 2.9 % |
| CWH | DDOG | Datadog, Inc. | Software - Application | 79 % | 1.9 % |
| SQZ | APP | Applovin Corporation | Software - Application | 78.6 % | 3.2 % |
| SQZ | MLR | Miller Industries, Inc. | Auto Parts | 77.9 % | 0.9 % |
| SQZ | SPNS | Sapiens International Corporation N.V. | Software - Application | 77.7 % | 4.3 % |
| CWH | GRC | Gorma | Specialty Industrial Machinery | 77.6 % | 0.3 % |
| SQZ | ONON | On Holding AG Class A Ord | Health Information Services | 77 % | 3.5 % |
| CWH | MNDY | monday.com Ltd. | Software - Application | 76.9 % | 1.8 % |
| SQZ | SPNT | SiriusPoint Ltd. | Insurance - Reinsurance | 76.8 % | 2.6 % |
| CWH | GFI | Gold Fields Limited Ameri | Gold | 76.6 % | 2.5 % |
| CWH | OWL | Blue Owl Capital Inc. | Asset Management | 76.6 % | 2.1 % |
| SQZ | NWLI | National Western Life Group, Inc. | Insurance - Life | 75.7 % | 0.1 % |
| CWH | GRBK | Green Brick Partners, Inc. | Residential Construction | 74.9 % | 2.5 % |
| *C score is our assessment of a Stock's correlation to CAN SLIM principles. It combines a stock's Technical and Fundamental merits and is expressed as a percentage. | |||||
Breakdowns within 5% of Breakdown Price
| Watchlist | Symbol | Company | Industry | C Score* | % Loss |
|---|---|---|---|---|---|
| SS | CRS | Carpenter Technology Corporation | Metal Fabrication | 76.6 % | -0.4 % |
| SS | MCK | McKesson Corporation | Medical Distribution | 66.4 % | -3.6 % |
| SS | FOA | Finance of America Companies Inc. | Credit Services | 45.9 % | -3.3 % |
| *C score is our assessment of a Stock's correlation to CAN SLIM principles. It combines a stock's Technical and Fundamental merits and is expressed as a percentage. | |||||
Cup and Handle Stocks Likely to Breakout next Week
| Symbol | BoP | Company | Industry | Relative Strength Rank | Within x% of BoP | C Score* |
|---|---|---|---|---|---|---|
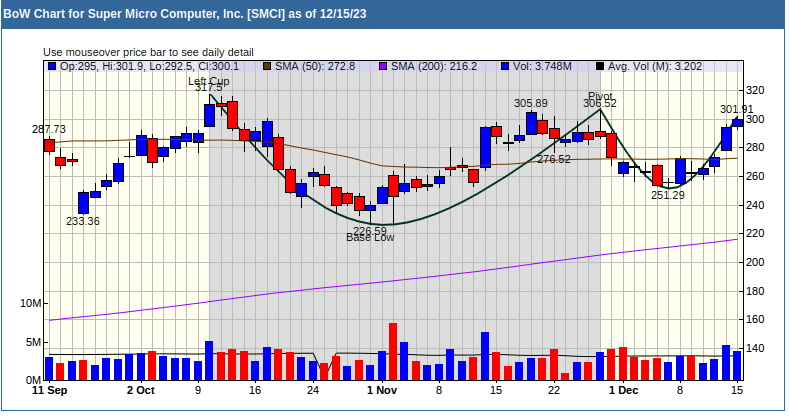
| SMCI | 306.52 | Super Micro Computer, Inc. | Computer Hardware | 98.00 | 97.91 | 79.8 |
| ORIC | 9.60 | Oric Pharmaceuticals, Inc. | Biotechnology | 97.00 | 96.98 | 57.2 |
| NVDA | 505.48 | NVIDIA Corporation | Semiconductors | 96.00 | 96.72 | 85.6 |
| SAIA | 428.79 | Saia, Inc. | Trucking | 91.00 | 96.75 | 78.7 |
| NFLX | 482.70 | Netflix, Inc. | Entertainment | 88.00 | 97.8 | 85.5 |
| SNFCA | 9.20 | Security National Financial Corporation | Mortgage Finance | 86.00 | 96.63 | 70.1 |
| *C score is our assessment of a Stock's correlation to CAN SLIM principles. It combines a stock's Technical and Fundamental merits and is expressed as a percentage. | ||||||
Cup and Handle Chart of the Week
Super Micro Computer Inc. (SMCI) set a CWH pivot on November 29 and since then formed a nicely shaped handle with accumulation in the right side of the handle putting it within 2% of the pivot. SMCI has a strong relative strength of 98 based on a gain of over 200% this year. SMCI shows the potential to return to its high of the year of 357, an 18% gain from Friday's close.', a
