Breakoutwatch Weekly Summary 12/30/2023
You are receiving this email because you are or were a
BreakoutWatch.com subscriber, or have subscribed to our weekly
newsletter.
To read this newsletter on the site, click here: Newsletter
.
Contents
Market Summary
Stocks end mixed to close out strong year
The major benchmarks were mixed for the holiday-shortened week. The S&P 500 Index marked its ninth straight weekly gain—its longest stretch since 2004—and briefly moved within 0.53% of its all-time intraday high. The week closed out a strong year for all the major indexes, led by the Nasdaq Composite, which recorded its sixth-biggest annual gain since the index was launched in 1971. As was widely expected, trading volumes and market moves were muted through most of the week, with trading closed Monday and many investors out of the office. [more...]
Major Index Performance
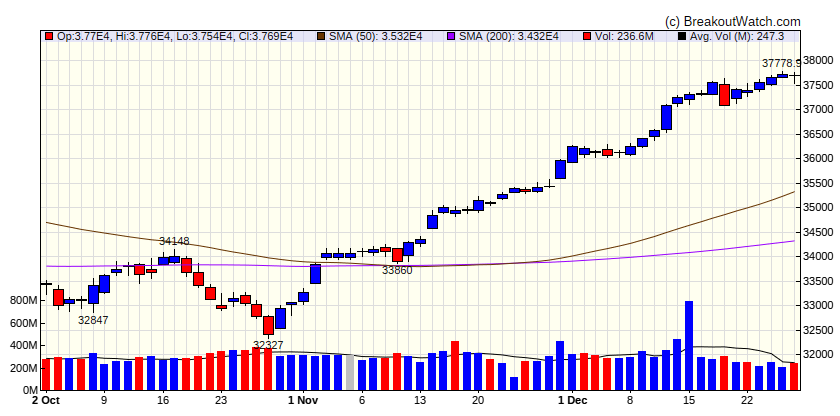
| Dow Jones | |
|---|---|
| Last Close | 37689.5 |
| Wk. Gain | 0.76 % |
| Yr. Gain | 13.7 % |
| Trend | Up |
|
|
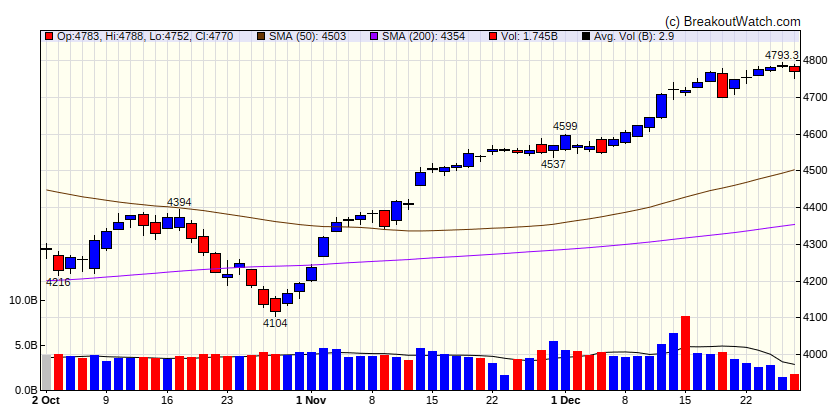
| S&P 500 | |
|---|---|
| Last Close | 4769.83 |
| Wk. Gain | 0.23 % |
| Yr. Gain | 23.8 % |
| Trend | Up |
|
|
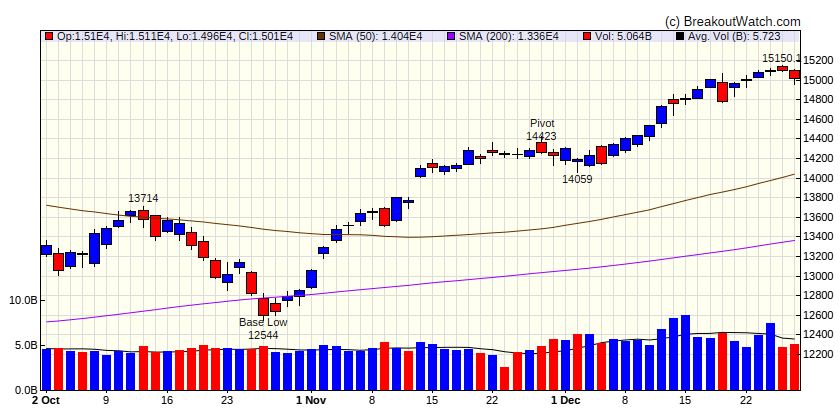
| NASDAQ Comp. | |
|---|---|
| Last Close | 15011.3 |
| Wk. Gain | -0.12 % |
| Yr. Gain | 42.13 % |
| Trend | Up |
|
|
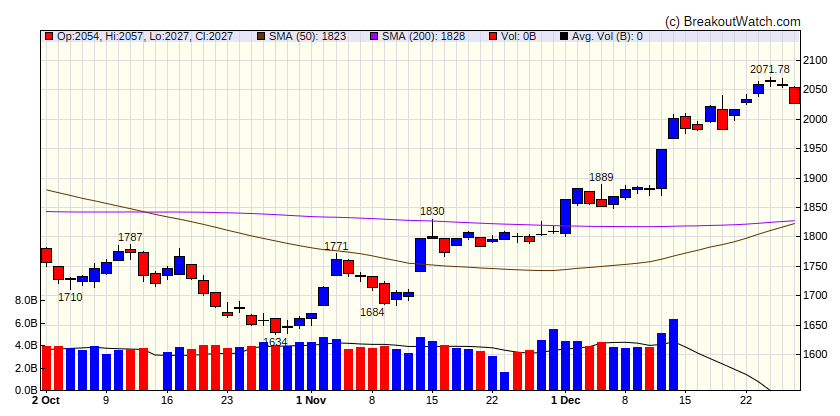
| Russell 2000 | |
|---|---|
| Last Close | 2027.07 |
| Wk. Gain | -0.79 % |
| Yr. Gain | 14.52 % |
| Trend | Up |
|
|
Performance by Sector
| Sector | Wk. Change % | Yr. Change % | Trend |
|---|---|---|---|
| Consumer Discretionary | -0.5 | 40.07 | Up |
| Consumer Staples | 1.07 | -0.58 | Up |
| Energy | -2.22 | -2.08 | Up |
| Finance | 0.71 | 11.94 | Up |
| Health Care | 0.94 | 1.25 | Up |
| Industrials | 0.42 | 20.98 | Up |
| Technology | -0.12 | 53.05 | Up |
| Materials | -0.3 | 11.58 | Up |
| REIT | 0.78 | 7.13 | Up |
| Telecom | -0.01 | 44.98 | Up |
| Utilities | 1.05 | -11.52 | Down |
Breakouts This Week Still Within 5% of Breakout Price (Limit 20 top C Score)
| Watchlist | Symbol | Company | Industry | C Score* | % Gain |
|---|---|---|---|---|---|
| CWH | KRT | Karat Packaging Inc. | Biotechnology | 80 % | 1.1 % |
| SQZ | LI | Li Auto Inc. | Auto Manufacturers | 77.6 % | 1.6 % |
| CWH | MIXT | MiX Telematics Limited Am | Software - Application | 77.2 % | 1.3 % |
| CWH | HY | Hyster-Yale Materials Handling, Inc. | Specialty Chemicals | 77.1 % | 1.3 % |
| SQZ | ESMT | EngageSmart, Inc. | Software - Infrastructure | 77.1 % | 0 % |
| SQZ | CPS | Cooper-Standard Holdings Inc. | Auto Parts | 76.3 % | 4.4 % |
| SQZ | NU | Nu Holdings Ltd. Class A | Banks - Regional | 74.4 % | 0.2 % |
| SQZ | NTRA | Natera, Inc. | Agricultural Inputs | 73.8 % | 2.4 % |
| SQZ | PR | Permian Resources Corporation Class A | Asset Management | 73.6 % | 0.5 % |
| SQZ | FSTR | L.B. Foster Company | Railroads | 73 % | 3.9 % |
| SQZ | FRHC | Freedom Holding Corp. | Capital Markets | 72 % | 0.4 % |
| CWH | EOLS | Evolus, Inc. | Asset Management | 70.6 % | 2 % |
| SQZ | DBRG | DigitalBridge Group, Inc. | Real Estate Services | 66.4 % | 1.2 % |
| SQZ | DRS | Leonardo DRS, Inc. | Biotechnology | 66.3 % | 1.8 % |
| CWH | JLL | Jones Lang LaSalle Inco | Real Estate Services | 66 % | 0.5 % |
| SQZ | SWI | SolarWinds Corporation | Software - Infrastructure | 65 % | 2.7 % |
| SQZ | TPC | Tutor Perini Corporation | Tobacco | 63.8 % | 0.8 % |
| SQZ | ACIC | American Coastal Insurance Corporation | Grocery Stores | 63.5 % | 1.7 % |
| SQZ | GRPN | Groupon, Inc. | Biotechnology | 61.7 % | 3.3 % |
| SQZ | VCSA | Vacasa, Inc. | Software - Application | 55 % | 0.7 % |
| *C score is our assessment of a Stock's correlation to CAN SLIM principles. It combines a stock's Technical and Fundamental merits and is expressed as a percentage. | |||||
Breakdowns within 5% of Breakdown Price
| Watchlist | Symbol | Company | Industry | C Score* | % Loss |
|---|---|---|---|---|---|
| SS | CEIX | CONSOL Energy Inc. | Thermal Coal | 72.4 % | -0.8 % |
| SS | NATR | N/A | Packaged Foods | 67.5 % | -0.7 % |
| SS | INSW | International Seaways, Inc. | Software - Application | 63.4 % | -2.1 % |
| SS | VTLE | Vital Energy, Inc. | Biotechnology | 53.7 % | -4 % |
| *C score is our assessment of a Stock's correlation to CAN SLIM principles. It combines a stock's Technical and Fundamental merits and is expressed as a percentage. | |||||
Cup and Handle Stocks Likely to Breakout next Week
| Symbol | BoP | Company | Industry | Relative Strength Rank | Within x% of BoP | C Score* |
|---|---|---|---|---|---|---|
| FSTR | 22.56 | L.B. Foster Company | Railroads | 93.00 | 97.47 | 73 |
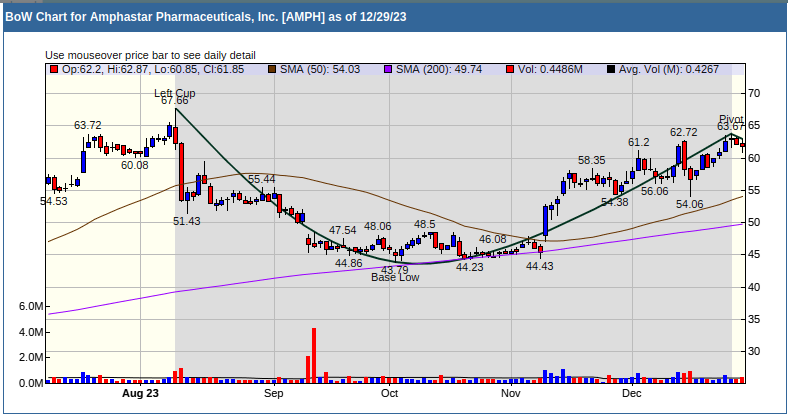
| AMPH | 63.67 | Amphastar Pharmaceuticals, Inc. | Drug Manufacturers - Specialty & Generic | 92.00 | 97.14 | 85.4 |
| TPG | 44.46 | TPG Inc. | Asset Management | 91.00 | 97.1 | 72.7 |
| XP | 27.03 | XP Inc. | Capital Markets | 90.00 | 96.45 | 81.3 |
| ABCB | 54.00 | Ameris Bancorp | Banks - Regional | 87.00 | 98.24 | 73 |
| NFLX | 500.89 | Netflix, Inc. | Entertainment | 87.00 | 97.2 | 86.8 |
| PNFP | 90.32 | Pinnacle Financial Partners, Inc. | Banks - Regional | 87.00 | 96.57 | 74.4 |
| *C score is our assessment of a Stock's correlation to CAN SLIM principles. It combines a stock's Technical and Fundamental merits and is expressed as a percentage. | ||||||
Cup and Handle Chart of the Week
