Breakoutwatch Weekly Summary 02/08/2024
You are receiving this email because you are or were a
BreakoutWatch.com subscriber, or have subscribed to our weekly
newsletter.
To read this newsletter on the site, click here: Newsletter
.
Market Summary
Large-cap benchmarks hit new highs, but small-caps struggle
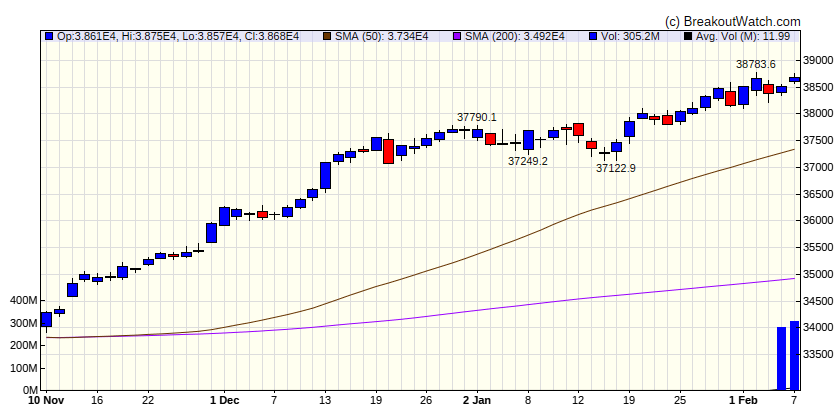
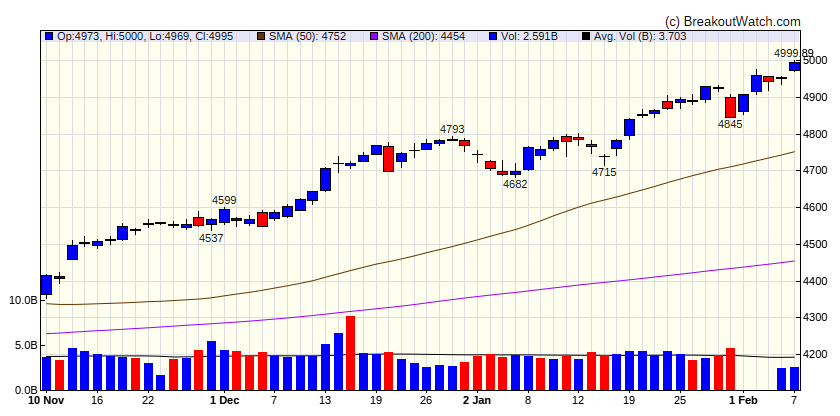
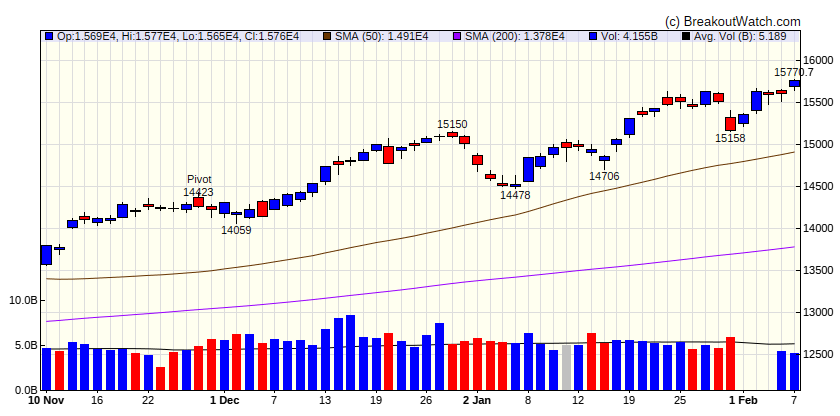
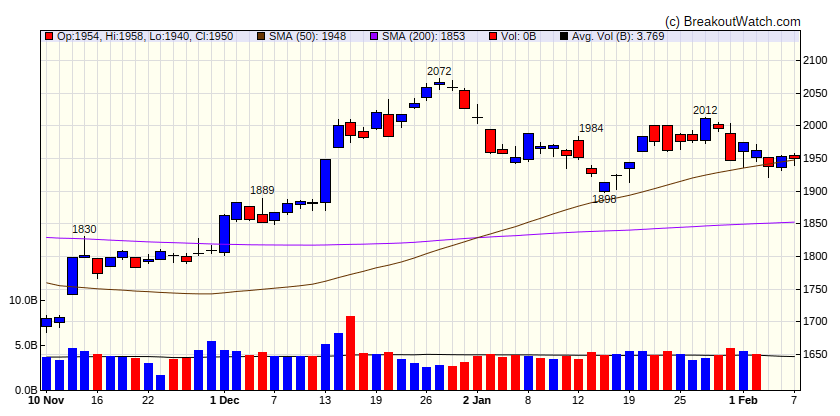
The major indexes ended the week mixed amid a slew of significant earnings reports and economic data. The S&P 500 Index and Dow Jones Industrial Average moved to intraday highs, but the small-cap indexes recorded losses. The advance was also narrow, with an equally weighted version of the S&P 500 Index recording a modest loss. The week closed out the month of January with the S&P 500 advancing 1.6% over the month, while the equal-weight S&P 500 fell 0.90%, and the small-cap Russell 2000 Index declined nearly 4.0%. [more...]
Major Index Performance
| Dow Jones
|
| Last Close
| 38677.4 |
| Wk. Gain
| 0.6 % |
| Yr. Gain
| 2.96 % |
| Trend
| Up |
|
| S&P 500
|
| Last Close
| 4995.06 |
| Wk. Gain
| 1.61 % |
| Yr. Gain
| 5.27 % |
| Trend
| Up |
|
| NASDAQ Comp.
|
| Last Close
| 15756.6 |
| Wk. Gain
| 2.29 % |
| Yr. Gain
| 5.93 % |
| Trend
| Up |
|
| Russell 2000
|
| Last Close
| 1950.36 |
| Wk. Gain
| -0.03 % |
| Yr. Gain
| -3.11 % |
| Trend
| Down |
|
Performance by Sector
| Sector |
Wk. Change % |
Yr. Change % |
Trend |
| Consumer Discretionary |
1.09 |
0.09 |
Up |
| Consumer Staples |
-0.55 |
2.49 |
Up |
| Energy |
-0.38 |
-1.3 |
Down |
| Finance |
0.98 |
3.03 |
Up |
| Health Care |
1.49 |
5.53 |
Up |
| Industrials |
1.74 |
2.7 |
Up |
| Technology |
2.85 |
6.92 |
Up |
| Materials |
-0.32 |
-2.9 |
Down |
| REIT |
-0.72 |
-5.09 |
Down |
| Telecom |
0 |
8.78 |
Up |
| Utilities |
-2.28 |
-4.11 |
Down |
Breakouts This Week Still Within 5% of Breakout Price (Limit 20 top C Score)
| Watchlist |
Symbol |
Company |
Industry |
C Score* |
% Gain |
| SQZ |
EDU |
New Oriental Education & Technology Group, Inc. |
Biotechnology |
82.1 % |
4 % |
| CWH |
FTNT |
Fortinet, Inc. |
Software - Infrastructure |
81 % |
4 % |
| SQZ |
STNE |
StoneCo Ltd. |
Software - Infrastructure |
79.8 % |
0.2 % |
| CWH |
MCO |
N/A |
Asset Management |
79.4 % |
0.4 % |
| SQZ |
CECO |
CECO Environmental Corp. |
Chemicals |
79.2 % |
0.1 % |
| SQZ |
CE |
Celanese Corporation |
Chemicals |
78 % |
0.8 % |
| SQZ |
EXPE |
Expedia Group, Inc. |
Travel Services |
77 % |
0.4 % |
| SQZ |
DY |
Dycom Industries, Inc. |
Industrial Distribution |
75.7 % |
2.1 % |
| DB |
CAAP |
Corporacion America Airports SA |
Banks - Diversified |
74.9 % |
0.8 % |
| SQZ |
SPIR |
Spire Global, Inc. |
Specialty Business Services |
73.9 % |
0.5 % |
| SQZ |
PATH |
UiPath, Inc. |
Software - Infrastructure |
73.7 % |
1.4 % |
| CWH |
HUBB |
Hubbell Inc |
Asset Management |
73.4 % |
2.3 % |
| CWH |
TGLS |
Tecnoglass Inc. |
Building Materials |
71.4 % |
0.9 % |
| SQZ |
ROKU |
Roku, Inc. |
Entertainment |
69.9 % |
1.1 % |
| SQZ |
BXC |
Bluelinx Holdings Inc. |
Industrial Distribution |
69.7 % |
1.3 % |
| CWH |
TME |
Tencent Music Entertainme |
Medical Devices |
69.5 % |
0.8 % |
| SQZ |
NET |
Cloudflare, Inc. |
Software - Infrastructure |
68.3 % |
2.1 % |
| CWH |
SNOW |
Snowflake Inc. |
Software - Application |
67.6 % |
3.8 % |
| CWH |
OC |
Owens Corning Inc |
Banks - Regional |
67.5 % |
1.5 % |
| DB |
TFII |
TFI International Inc. |
Trucking |
66 % |
2.3 % |
| *C score is our assessment of a Stock's correlation to CAN SLIM principles. It combines a stock's Technical and Fundamental merits and is expressed as a percentage. |
Breakdowns within 5% of Breakdown Price
| Watchlist |
Symbol |
Company |
Industry |
C Score* |
% Loss |
| SS |
NGS |
Natural Gas Services Group, Inc. |
Biotechnology |
73.4 % |
-2.9 % |
| SS |
GFI |
Gold Fields Limited Ameri |
Gold |
68.4 % |
-1.1 % |
| SS |
OII |
Oceaneering International, Inc. |
Asset Management |
66.6 % |
-3 % |
| SS |
MARA |
Marathon Digital Holdings, Inc. |
Capital Markets |
64.4 % |
-1 % |
| SS |
HAL |
Halliburton Company |
Packaged Foods |
61.9 % |
-4.6 % |
| SS |
GCI |
Gannett Co., Inc. |
Publishing |
55.7 % |
-0.9 % |
| SS |
RXRX |
Recursion Pharmaceuticals, Inc. |
Biotechnology |
47.6 % |
-0.7 % |
| SS |
ULBI |
Ultralife Corporation |
Real Estate Services |
31.2 % |
-4.3 % |
| SS |
WOR |
Worthington Enterprises, Inc. |
Metal Fabrication |
26.4 % |
-1.2 % |
| SS |
VTLE |
Vital Energy, Inc. |
Biotechnology |
22.3 % |
-4.2 % |
| SS |
YEXT |
Yext, Inc. |
Software - Infrastructure |
15.5 % |
-3.1 % |
| *C score is our assessment of a Stock's correlation to CAN SLIM principles. It combines a stock's Technical and Fundamental merits and is expressed as a percentage. |
| There were no CWH stocks meeting our breakout model criteria |
| *C score is our assessment of a Stock's correlation to CAN SLIM principles. It combines a stock's Technical and Fundamental merits and is expressed as a percentage. |
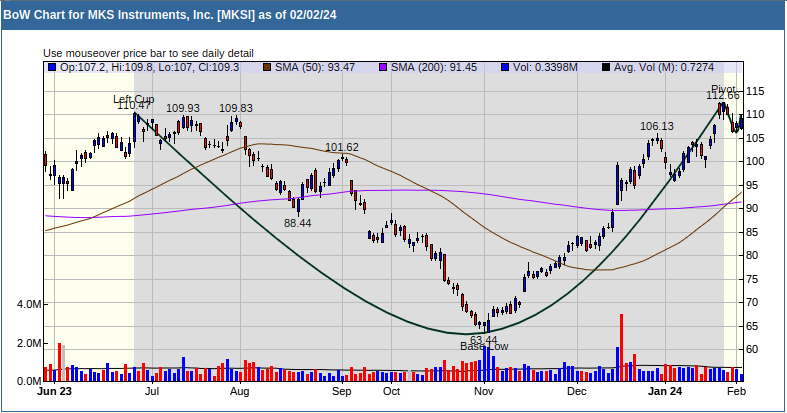
Cup and Handle Chart of the Week
MKS Intruments obtained the best score in my cup and handle breakout model. Although SURG has a higher CAN SLIM score, MKSI is closer to breakout.
