Breakoutwatch Weekly Summary 05/04/2024
You are receiving this email because you are or were a
BreakoutWatch.com subscriber, or have subscribed to our weekly
newsletter.
To read this newsletter on the site, click here: Newsletter
.
Contents
Market Summary
Late rally lifts small-caps back into positive territory for 2024
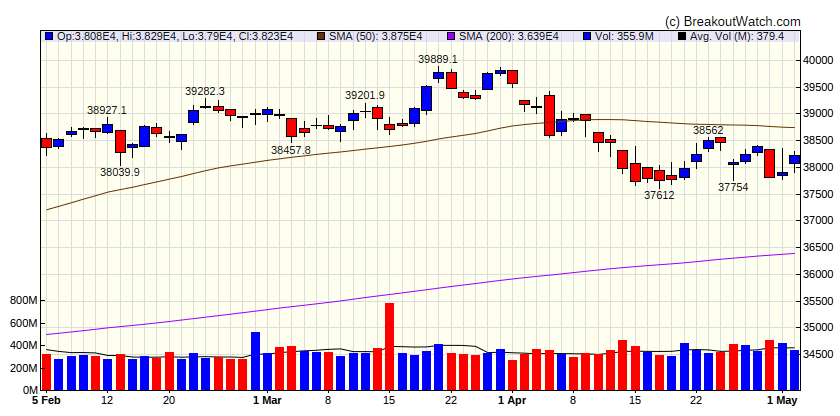
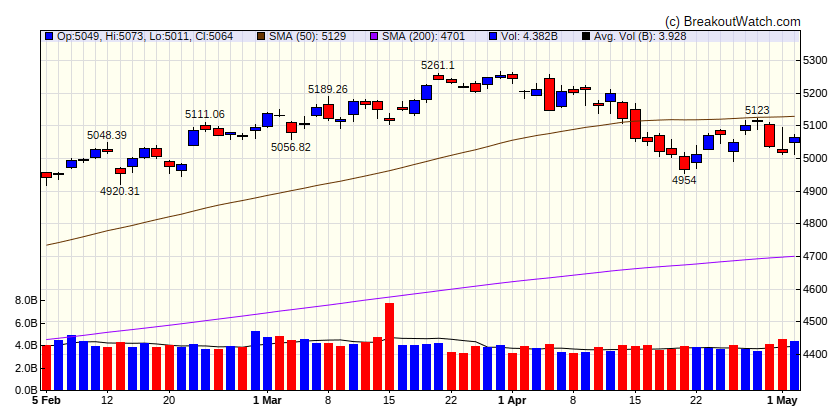
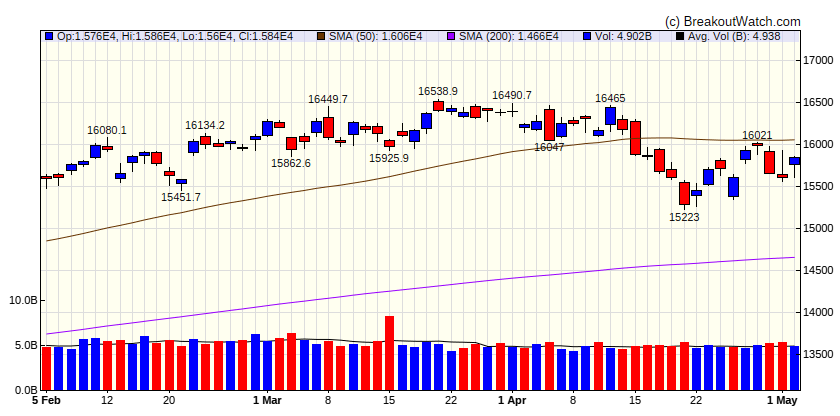
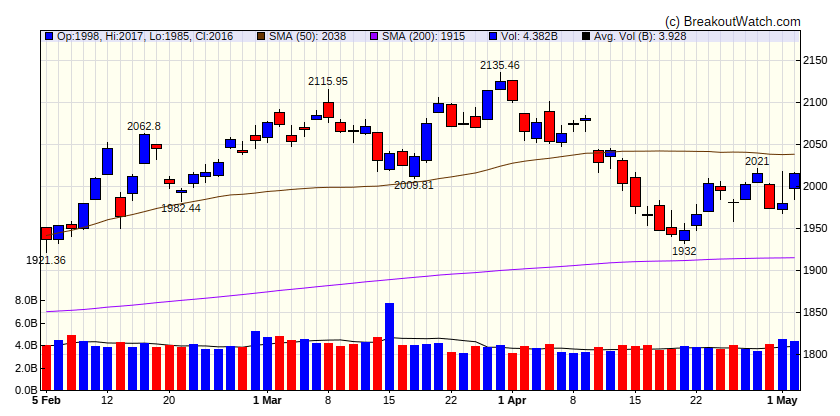
Stocks ended higher following a volatile week featuring a raft of economic and earnings data. Growth stocks outperformed value shares, which were flat overall for the week. Small-caps outpaced large-caps, helping lift the small-cap Russell 2000 Index back into slightly positive territory for the year-to-date period. [more...]
Major Index Performance
| Dow Jones | |
|---|---|
| Last Close | |
| Wk. Gain | -100 % |
| Yr. Gain | -100 % |
| Trend | Down |

|
|
| S&P 500 | |
|---|---|
| Last Close | |
| Wk. Gain | -100 % |
| Yr. Gain | -100 % |
| Trend | Down |

|
|
| NASDAQ Comp. | |
|---|---|
| Last Close | |
| Wk. Gain | -100 % |
| Yr. Gain | -100 % |
| Trend | Down |

|
|
| Russell 2000 | |
|---|---|
| Last Close | |
| Wk. Gain | -100 % |
| Yr. Gain | -100 % |
| Trend | Down |

|
|
Performance by Sector
| Sector | Wk. Change % | Yr. Change % | Trend |
|---|---|---|---|
| Consumer Discretionary | -0.29 | 1.2 | Up |
| Consumer Staples | 0.45 | 6.3 | Up |
| Energy | -3.13 | 9.5 | Down |
| Finance | -0.3 | 7.57 | Down |
| Health Care | 0.88 | 3.33 | Up |
| Industrials | 0.19 | 8.49 | Down |
| Technology | 0.67 | 6.58 | Down |
| Materials | -0.02 | 4.39 | Down |
| REIT | 0.98 | -7.66 | Down |
| Telecom | 1.11 | 11.42 | Down |
| Utilities | 2.93 | 9.04 | Up |
Breakouts This Week Still Within 5% of Breakout Price (Limit 20 top C Score)
| Watchlist | Symbol | Company | Industry | C Score* | % Gain |
|---|---|---|---|---|---|
| SQZ | GLP | Global Partners LP | Information Technology Services | 68.1 % | 1.8 % |
| SQZ | UVE | UNIVERSAL INSURANCE HOLDINGS INC | Uranium | 65.5 % | 1.4 % |
| CWH | GNK | Genco Shipping & Trading | Marine Shipping | 62.9 % | 3 % |
| SQZ | GIII | N/A | Apparel Manufacturing | 59 % | 1.5 % |
| SQZ | NEXA | Nexa Resources S.A. | Banks - Regional | 58.9 % | 0.4 % |
| SQZ | SILK | Silk Road Medical, Inc. | Medical Devices | 52.2 % | 4.3 % |
| SQZ | RACE | Ferrari N.V. | Auto Manufacturers | 36.7 % | 3.5 % |
| *C score is our assessment of a Stock's correlation to CAN SLIM principles. It combines a stock's Technical and Fundamental merits and is expressed as a percentage. | |||||
Breakdowns within 5% of Breakdown Price
| Watchlist | Symbol | Company | Industry | C Score* | % Loss |
|---|---|---|---|---|---|
| SS | URI | United Rentals, Inc. | Biotechnology | 75.4 % | -1.9 % |
| SS | SKT | Tanger Inc. | REIT - Retail | 74.2 % | -3.5 % |
| *C score is our assessment of a Stock's correlation to CAN SLIM principles. It combines a stock's Technical and Fundamental merits and is expressed as a percentage. | |||||
Cup and Handle Stocks Likely to Breakout next Week
| Symbol | BoP | Company | Industry | Relative Strength Rank | Within x% of BoP | C Score* |
|---|---|---|---|---|---|---|
| SLNO | 0 | N/A | 99.00 | 56.9 | ||
| DOMA | 0 | N/A | 99.00 | 65.7 | ||
| STTK | 59.7 | |||||
| PESI | 0 | N/A | 86.00 | 70 | ||
| DUOL | 76.7 | |||||
| EVBG | 0 | N/A | 89.00 | 66.5 | ||
| NSSC | 0 | N/A | 90.00 | 78.7 | ||
| SYF | 74.9 | |||||
| HCC | 0 | N/A | 89.00 | 75.5 | ||
| KLAC | 0 | N/A | 87.00 | 61.2 | ||
| AAON | 73.8 | |||||
| TXRH | 76.6 | |||||
| AMRK | 0 | N/A | 86.00 | 76.9 | ||
| FWRG | 0 | N/A | 84.00 | 79.4 | ||
| MATV | 64.8 | |||||
| ZBRA | 0 | N/A | 82.00 | 65.2 | ||
| NR | 0 | N/A | 83.00 | 63.7 | ||
| SE | 71.8 | |||||
| SEMR | 73.6 | |||||
| TOST | 69.2 | |||||
| STER | 0 | N/A | 82.00 | 61.1 | ||
| CCJ | 0 | N/A | 82.00 | 71.9 | ||
| AG | 0 | N/A | 81.00 | 38.7 | ||
| AVPT | 0 | N/A | 81.00 | 67.3 | ||
| ENV | 70.6 | |||||
| TSQ | 58.4 | |||||
| *C score is our assessment of a Stock's correlation to CAN SLIM principles. It combines a stock's Technical and Fundamental merits and is expressed as a percentage. | ||||||
Cup and Handle Chart of the Week
There were no cup and handle stocks meeting our breakout model criteria this week.