Breakoutwatch Weekly Summary 05/26/2024
You are receiving this email because you are or were a
BreakoutWatch.com subscriber, or have subscribed to our weekly
newsletter.
To read this newsletter on the site, click here: Newsletter
.
Contents
Market Summary
Nasdaq hits new records while Dow suffers worst week since early April
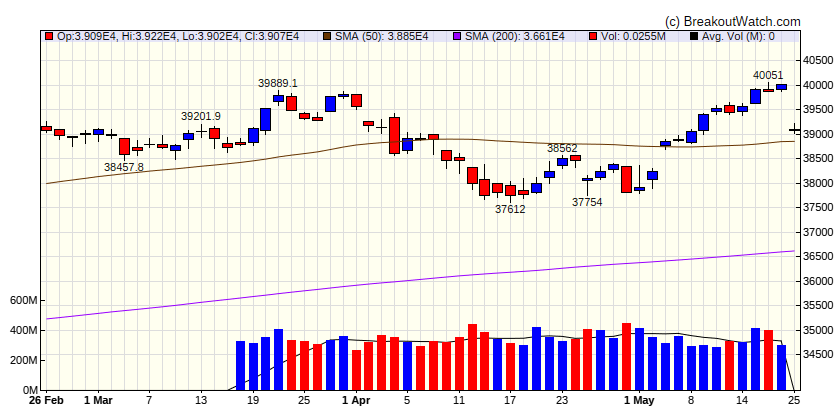
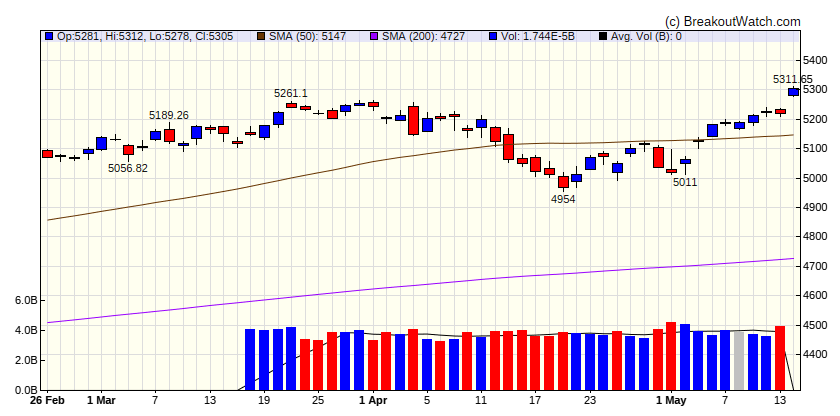
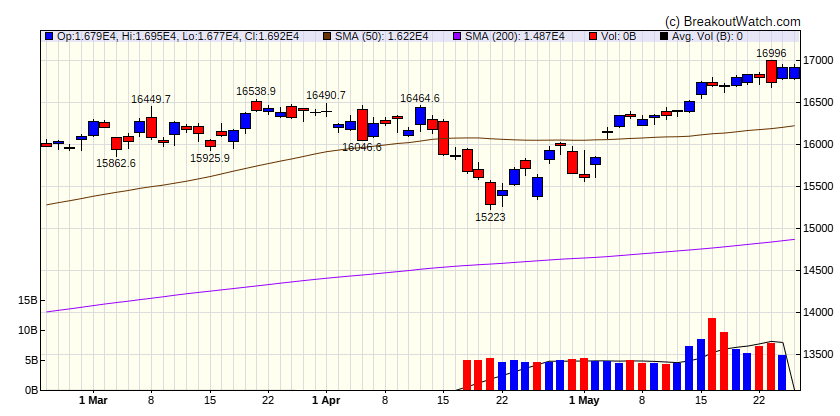
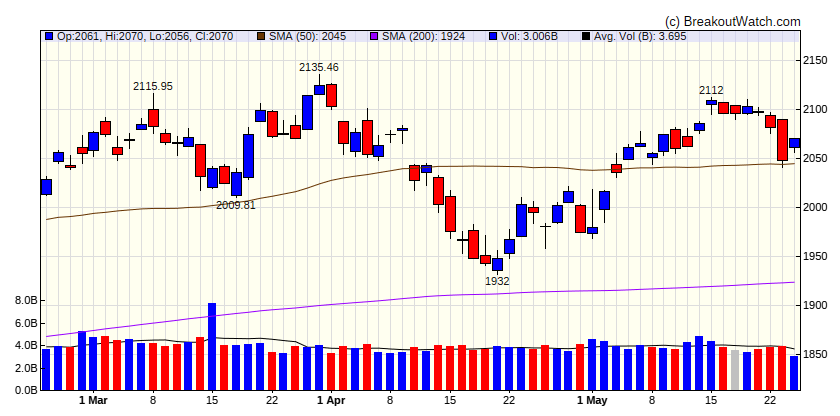
The major indexes recorded widely varying results over the week, with the Dow Jones Industrial Average recording its biggest weekly loss (-2.33%) since early April, while the technology-heavy Nasdaq Composite continued its recent march into record territory. The broad S&P 500 Index was roughly flat, while small-cap stocks lost ground. The disparate returns were also reflected in the substantial underperformance of an equal-weighted version of the S&P 500 Index, which trailed its more familiar, market-weighted counterpart by 127 basis points (1.27 percentage points). The market was scheduled to be closed the following Monday in observance of the Memorial Day holiday. [more...]
Major Index Performance
| Dow Jones | |
|---|---|
| Last Close | 39069.6 |
| Wk. Gain | -0.05 % |
| Yr. Gain | 4 % |
| Trend | Up |

|
|
| S&P 500 | |
|---|---|
| Last Close | 5304.72 |
| Wk. Gain | 0.44 % |
| Yr. Gain | 11.79 % |
| Trend | Up |

|
|
| NASDAQ Comp. | |
|---|---|
| Last Close | 16920.8 |
| Wk. Gain | 1.31 % |
| Yr. Gain | 13.76 % |
| Trend | Up |

|
|
| Russell 2000 | |
|---|---|
| Last Close | 16920.8 |
| Wk. Gain | 706.91 % |
| Yr. Gain | 740.68 % |
| Trend | Up |

|
|
Performance by Sector
| Sector | Wk. Change % | Yr. Change % | Trend |
|---|---|---|---|
| Consumer Discretionary | 5324.38 | 5482.21 | Down |
| Consumer Staples | 8784.64 | 8709.7 | Up |
| Energy | 13771.78 | 21660.29 | Down |
| Finance | 17310.02 | 23050.64 | Up |
| Health Care | 7497 | 8686.83 | Up |
| Industrials | 10833.57 | 11617.19 | Up |
| Technology | 7622.16 | 7622.16 | Up |
| Materials | 13511.78 | 13511.78 | Up |
| REIT | 18065.11 | 18065.11 | Up |
| Telecom | 19304.59 | 19304.59 | Up |
| Utilities | 11893.76 | 11893.76 | Up |
Breakouts This Week Still Within 5% of Breakout Price (Limit 20 top C Score)
| Watchlist | Symbol | Company | Industry | C Score* | % Gain |
|---|---|---|---|---|---|
| *C score is our assessment of a Stock's correlation to CAN SLIM principles. It combines a stock's Technical and Fundamental merits and is expressed as a percentage. | |||||
Breakdowns within 5% of Breakdown Price
| Watchlist | Symbol | Company | Industry | C Score* | % Loss | There were no Breakdowns still within 5% of breakdown price this week |
|---|---|---|---|---|---|
| *C score is our assessment of a Stock's correlation to CAN SLIM principles. It combines a stock's Technical and Fundamental merits and is expressed as a percentage. | |||||
Cup and Handle Stocks Likely to Breakout next Week
| Symbol | BoP | Company | Industry | Relative Strength Rank | Within x% of BoP | C Score* |
|---|---|---|---|---|---|---|
| SLNO | 0 | Western Alliance Bancorporation | Household & Personal Products | 76.00 | 59.1 | |
| GCT | 83.2 | |||||
| LBPH | 23.96 | Longboard Pharmaceuticals, Inc. | Biotechnology | 97.00 | 78.46 | 57.7 |
| MOD | 109.53 | Modine Manufacturing Company | Specialty Retail | 94.00 | 94.72 | 81.8 |
| ALXO | 17.83 | ALX Oncology Holdings Inc. | Biotechnology | 93.00 | 73.86 | 51.4 |
| ITOS | 18.75 | iTeos Therapeutics, Inc. | Biotechnology | 92.00 | 94.29 | 52.5 |
| SKYH | 13.47 | Sky Harbour Group Corporation Class A | Apparel Retail | 93.00 | 93.54 | 65.8 |
| ATNM | 10.24 | Actinium Pharmaceuticals, Inc. | Biotechnology | 87.00 | 83.01 | 56 |
| MRUS | 64.5 | |||||
| PEPG | 48.1 | |||||
| SNAP | 65.9 | |||||
| ARDX | 56.7 | |||||
| TILE | 58.7 | |||||
| IOT | 42.28 | Samsara Inc. | Utilities - Regulated Gas | 86.00 | 93.12 | 75.1 |
| HOV | 184.42 | Hovnanian Enterprises, Inc. | Apparel Retail | 81.00 | 75.65 | 51.7 |
| KKR | 79.4 | |||||
| UTI | 17.09 | Universal Technical Institute Inc | Biotechnology | 85.00 | 89.82 | 75 |
| LPG | 82.3 | |||||
| EDN | 53.8 | |||||
| ALKT | 73.4 | |||||
| OSG | 78.8 | |||||
| EVBG | 35.70 | Everbridge, Inc. | Utilities - Renewable | 89.00 | 97.34 | 64.6 |
| ELAN | 17.43 | Elanco Animal Health Inco | Recreational Vehicles | 80.00 | 96.33 | 55.4 |
| CLBT | 69.4 | |||||
| URI | 715.34 | United Rentals, Inc. | Biotechnology | 82.00 | 94.16 | 74.9 |
| ELMD | 71.1 | |||||
| RVLV | 23.04 | Revolve Group, Inc. | Personal Services | 82.00 | 84.03 | 61.7 |
| AGIO | 54.4 | |||||
| HEAR | 16.92 | Turtle Beach Corporation | Utilities - Independent Power Producers | 91.00 | 96.63 | 71.1 |
| ENV | 75.7 | |||||
| WIX | 75.2 | |||||
| W | 58.6 | |||||
| ERIE | 411.72 | Erie Indemnity Company | Beverages - Brewers | 87.00 | 94.47 | 78.2 |
| AMRK | 42.48 | A-Mark Precious Metals, Inc. | Beverages - Non-Alcoholic | 85.00 | 89.45 | 73.7 |
| RPAY | 11.04 | Repay Holdings Corporation | Utilities - Regulated Gas | 81.00 | 88.5 | 56.2 |
| QRTEP | 51.20 | Qurate Retail, Inc. | Personal Services | 83.00 | 97.27 | 36.1 |
| NHC | 67.4 | |||||
| LMNR | 59.7 | |||||
| SHAK | 73.6 | |||||
| DVA | 75.1 | |||||
| GWRE | 64 | |||||
| CTAS | 67.1 | |||||
| CFG | 37.30 | Citizens Financial Group, Inc. | Household & Personal Products | 81.00 | 94.77 | 68.8 |
| AESI | 24.93 | Atlas Energy Solutions Inc. | Marine Shipping | 84.00 | 95.59 | 70.8 |
| SEM | 35.08 | Select Medical Holdings Corporation | Health Information Services | 80.00 | 93.87 | 77.1 |
| TRUP | 63.5 | |||||
| ANAB | 57.3 | |||||
| MATV | 62.8 | |||||
| FHN | 68.8 | |||||
| *C score is our assessment of a Stock's correlation to CAN SLIM principles. It combines a stock's Technical and Fundamental merits and is expressed as a percentage. | ||||||
Cup and Handle Chart of the Week
There were no cup and handle stocks meeting our breakout model criteria this week.