Breakoutwatch Weekly Summary 06/28/2024
You are receiving this email because you are or were a
BreakoutWatch.com subscriber, or have subscribed to our weekly
newsletter.
To read this newsletter on the site, click here: Newsletter
.
Contents
Market Summary
Small-caps and tech stocks outperform in quiet week
Most major U.S. stock indexes posted gains in a light news week during what seemed to be a bit of a lull in market activity ahead of second-quarter earnings reports, according to T. Rowe Price traders. Small-cap companies and information technology stocks performed best, with growth stocks outpacing their value cousins. Index provider FTSE Russell was due to rebalance its series of Russell indexes after the close on Friday, so some of the week’s activity may have stemmed from positioning adjustments by investors tracking those indexes. [more...]
Major Index Performance
| Dow Jones | |
|---|---|
| Last Close | 39119 |
| Wk. Gain | INF % |
| Yr. Gain | 4.13 % |
| Trend | Up |
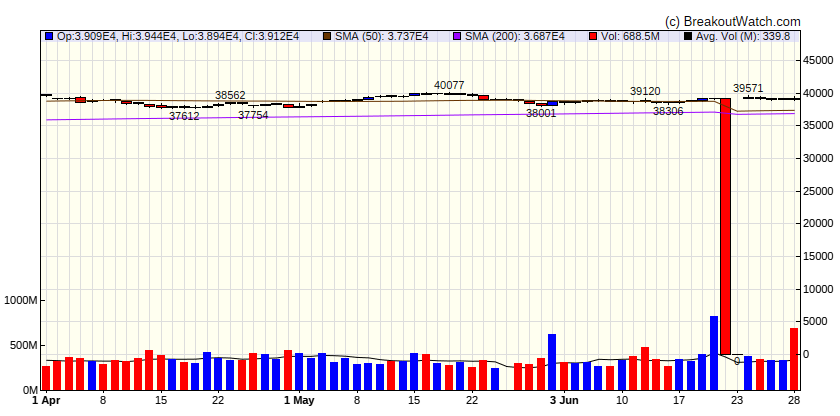
|
|
| S&P 500 | |
|---|---|
| Last Close | 5460 |
| Wk. Gain | INF % |
| Yr. Gain | 15.07 % |
| Trend | Up |
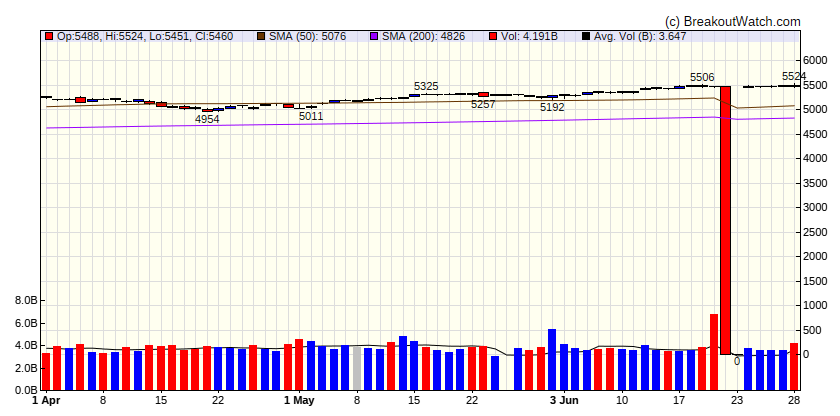
|
|
| NASDAQ Comp. | |
|---|---|
| Last Close | 17733 |
| Wk. Gain | INF % |
| Yr. Gain | 19.22 % |
| Trend | Up |
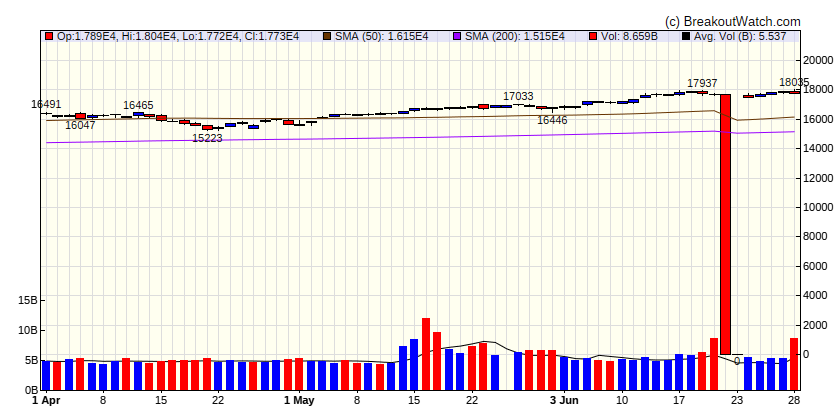
|
|
| Russell 2000 | |
|---|---|
| Last Close | 2048 |
| Wk. Gain | 1.24 % |
| Yr. Gain | 1.74 % |
| Trend | Down |
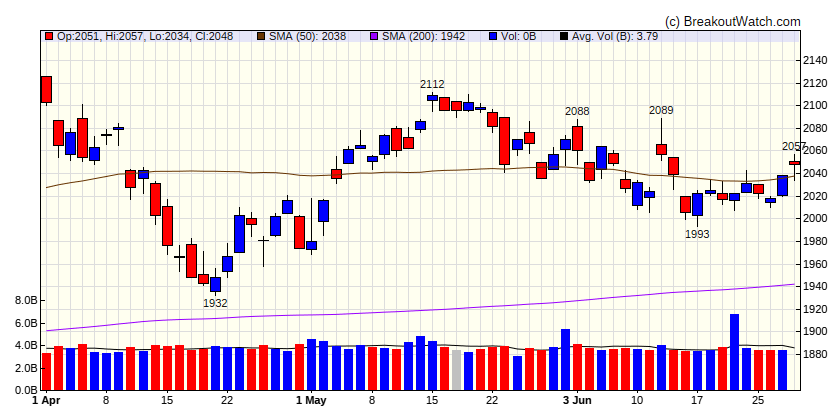
|
|
Performance by Sector
| Sector | Wk. Change % | Yr. Change % | Trend |
|---|---|---|---|
| Consumer Discretionary | -0.11 | 3.04 | Up |
| Consumer Staples | -1.52 | 6.68 | Down |
| Energy | 1.25 | 8.15 | Up |
| Finance | -0.54 | 8.86 | Up |
| Health Care | -1.06 | 6.53 | Up |
| Industrials | -1.13 | 7.47 | Down |
| Technology | 0.36 | 20.63 | Up |
| Materials | -1.72 | 2.04 | Down |
| REIT | -0.3 | -4.87 | Up |
| Telecom | 0.93 | 18.18 | Up |
| Utilities | -1.62 | 8.49 | Down |
Breakouts This Week Still Within 5% of Breakout Price (Limit 20 top C Score)
| Watchlist | Symbol | Company | Industry | C Score* | % Gain |
|---|---|---|---|---|---|
| HTF | RDW | Redwire Corporation | Utilities - Renewable | 43.6 % | 1.8 % |
| DB | ZETA | Zeta Global Holdings Corp. Class A | Utilities - Renewable | 41 % | 0.4 % |
| SQZ | JXN | Jackson Financial Inc. | Grocery Stores | 40.7 % | 1.4 % |
| SQZ | ATGE | Adtalem Global Education Inc. | Education & Training Services | 40.4 % | 3.4 % |
| SQZ | HTLF | Heartland Financial USA, Inc. | Banks - Regional | 39.8 % | 2.9 % |
| CWH | SMLP | Summit Midstream Partners, LP | Oil & Gas Midstream | 39.7 % | 3.3 % |
| CWH | PRFT | Perficient, Inc. | Utilities - Regulated Electric | 39.6 % | 0.2 % |
| DB | IBCP | Independent Bank Corporation | Household & Personal Products | 39.1 % | 1.2 % |
| SQZ | RXST | RxSight, Inc. | Drug Manufacturers - General | 39.1 % | 1.8 % |
| CWH | MIRM | Mirum Pharmaceuticals, Inc. | Biotechnology | 39 % | 1.9 % |
| SQZ | PGY | Pagaya Technologies Ltd. | Software - Infrastructure | 39 % | 4.1 % |
| CWH | LTH | Life Time Group Holdings, Inc. | Leisure | 38.9 % | 1.1 % |
| SQZ | LOCO | El Pollo Loco Holdings, Inc. | Restaurants | 38.6 % | 2.2 % |
| SQZ | MNDY | monday.com Ltd. | Utilities - Renewable | 38.6 % | 1.9 % |
| SQZ | NN | NextNav Inc. | Software - Infrastructure | 38.5 % | 2.8 % |
| CWH | HTBI | HomeTrust Bancshares, Inc. | Household & Personal Products | 38.4 % | 0.8 % |
| SQZ | BLFS | BioLife Solutions, Inc. | Medical Instruments & Supplies | 38.4 % | 0.3 % |
| SQZ | TYL | Tyler Technologies, Inc. | Utilities - Renewable | 38.2 % | 1.8 % |
| SQZ | MFC | Manulife Financial Corporation | Grocery Stores | 38.1 % | 0.4 % |
| SQZ | APP | Applovin Corporation | Utilities - Renewable | 38 % | 0.1 % |
| *C score is our assessment of a Stock's correlation to CAN SLIM principles. It combines a stock's Technical and Fundamental merits and is expressed as a percentage. | |||||
Breakdowns within 5% of Breakdown Price
| Watchlist | Symbol | Company | Industry | C Score* | % Loss |
|---|---|---|---|---|---|
| SS | GATO | Gatos Silver, Inc. | Other Precious Metals & Mining | 37.7 % | -2.5 % |
| SS | PAAS | Pan American Silver Corp. | Gold | 36.9 % | -0.5 % |
| SS | ESPR | Esperion Therapeutics, Inc. | Drug Manufacturers - Specialty & Generic | 36.4 % | -4.3 % |
| SS | GE | GE Aerospace | Aerospace & Defense | 35.5 % | -1.3 % |
| SS | AXTI | AXT Inc | Advertising Agencies | 31.8 % | -1.2 % |
| SS | GIII | N/A | Apparel Manufacturing | 30.5 % | -3.4 % |
| SS | OLMA | Olema Pharmaceuticals, Inc. | Biotechnology | 25.4 % | -0.1 % |
| SS | ACHR | Archer Aviation Inc. | Aerospace & Defense | 18 % | -3.3 % |
| *C score is our assessment of a Stock's correlation to CAN SLIM principles. It combines a stock's Technical and Fundamental merits and is expressed as a percentage. | |||||
Cup and Handle Chart of the Week
There were no cup and handle stocks meeting our breakout model criteria this week.