Breakoutwatch Weekly Summary 07/20/2024
You are receiving this email because you are or were a
BreakoutWatch.com subscriber, or have subscribed to our weekly
newsletter.
To read this newsletter on the site, click here: Newsletter
.
Contents
Market Summary
Investors continue turn to value and small-caps
The major indexes ended mixed in a week that saw a continued rotation in market leadership to small-cap and value shares. The narrowly focused Dow Jones Industrial Average outperformed, and value stocks outpaced growth stocks by 477 basis points (4.77 percentage points), as measured by Russell indexes—the largest divergence since March 2023, when growth shares outperformed by 654 basis points. The week was also notable for a widespread global disruption to computer systems early Friday due to an error in a vendor’s security update to some users of the Microsoft operating system. The problems seemed to have little impact on U.S. trading, however. [more...]
Major Index Performance
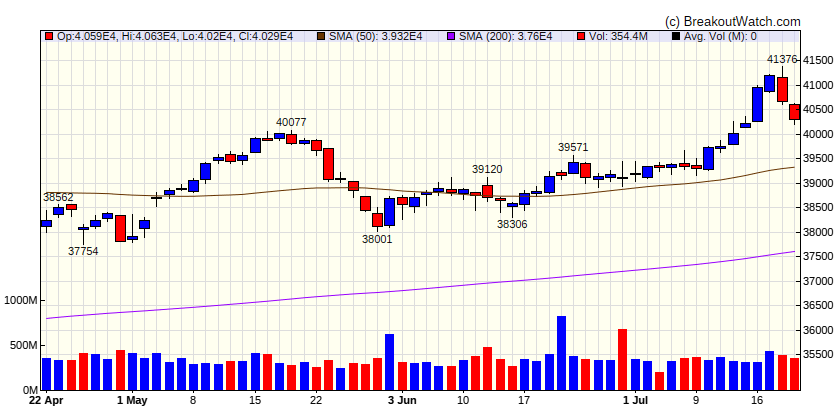
| Dow Jones | |
|---|---|
| Last Close | 40288 |
| Wk. Gain | 0.37 % |
| Yr. Gain | 7.25 % |
| Trend | Up |
|
|
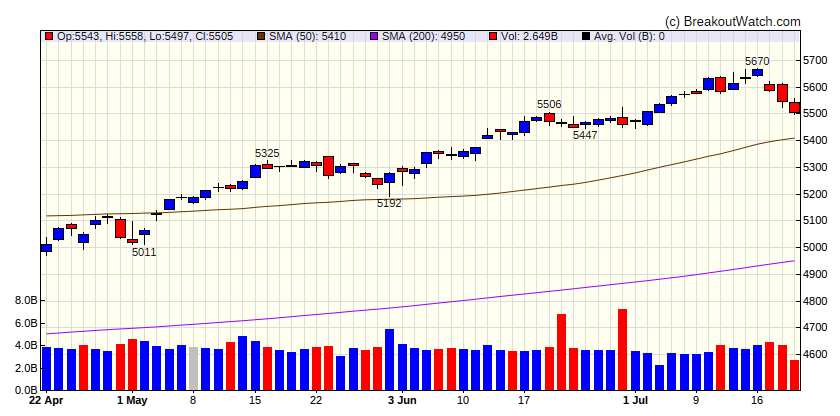
| S&P 500 | |
|---|---|
| Last Close | 5505 |
| Wk. Gain | -2.36 % |
| Yr. Gain | 16.02 % |
| Trend | Up |
|
|
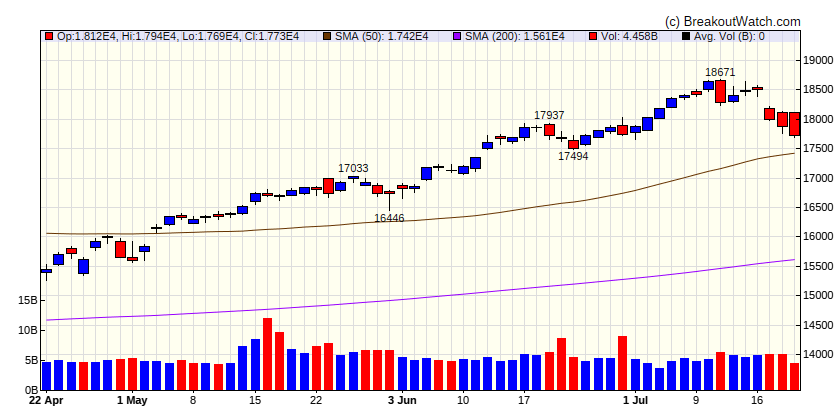
| NASDAQ Comp. | |
|---|---|
| Last Close | 17727 |
| Wk. Gain | -4.11 % |
| Yr. Gain | 19.18 % |
| Trend | Up |
|
|
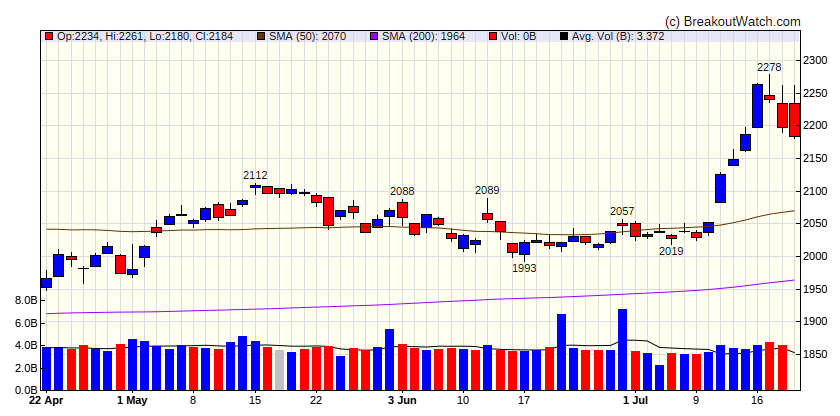
| Russell 2000 | |
|---|---|
| Last Close | 2184 |
| Wk. Gain | 1.02 % |
| Yr. Gain | 8.49 % |
| Trend | Up |
|
|
Performance by Sector
| Sector | Wk. Change % | Yr. Change % | Trend |
|---|---|---|---|
| Consumer Discretionary | -2.43 | 5.39 | Up |
| Consumer Staples | 0.68 | 8.66 | Up |
| Energy | 1.08 | 9.88 | Up |
| Finance | 1.07 | 13.94 | Up |
| Health Care | -0.79 | 8.49 | Up |
| Industrials | 0.26 | 10.56 | Up |
| Technology | -5.4 | 19.84 | Down |
| Materials | -0.33 | 4.95 | Up |
| REIT | 1.34 | 0.84 | Up |
| Telecom | -1.78 | 16.84 | Down |
| Utilities | -0.29 | 11.92 | Up |
Breakouts This Week Still Within 5% of Breakout Price (Limit 20 top C Score)
| Watchlist | Symbol | Company | Industry | C Score* | % Gain |
|---|---|---|---|---|---|
| SQZ | STRA | Strategic Education, Inc. | Biotechnology | 75.3 % | 2.8 % |
| SQZ | VCTR | Victory Capital Holdings, Inc. | Packaged Foods | 75.3 % | 1.1 % |
| SQZ | MCY | Mercury General Corporation | Apparel Manufacturing | 73.4 % | 3.5 % |
| SQZ | IGIC | International General Insurance Holdings Ltd. | Confectioners | 73.2 % | 2.7 % |
| SQZ | GENC | Gencor Industries, Inc. | Utilities - Regulated Gas | 70.9 % | 1.6 % |
| SQZ | PRM | Perimeter Solutions, SA O | Advertising Agencies | 70.8 % | 4.2 % |
| SQZ | ELMD | Electromed, Inc. | Drug Manufacturers - General | 70.5 % | 3.6 % |
| CWH | PPC | Pilgrim's Pride Corporation | Insurance - Specialty | 69.4 % | 1.1 % |
| SQZ | PLNT | Planet Fitness, Inc. | Lodging | 69.1 % | 1.5 % |
| SQZ | SGC | Superior Group of Companies, Inc. | Leisure | 68.2 % | 0.8 % |
| SQZ | MGNI | Magnite, Inc. | Gold | 65.8 % | 5 % |
| SQZ | CNM | Core & Main, Inc. | Electronics & Computer Distribution | 65.3 % | 0.5 % |
| SQZ | HRB | H&R Block, Inc. | Apparel Manufacturing | 65 % | 2.1 % |
| SQZ | CLBT | Cellebrite DI Ltd. | Utilities - Regulated Gas | 63.9 % | 4 % |
| SQZ | GRPN | Groupon, Inc. | Biotechnology | 63.7 % | 0.5 % |
| SQZ | KD | Kyndryl Holdings, Inc. | Utilities - Regulated Electric | 62 % | 3 % |
| SQZ | OSPN | OneSpan Inc. | Utilities - Regulated Gas | 62 % | 0.3 % |
| SQZ | GDRX | GoodRx Holdings, Inc. | Medical Care Facilities | 61.3 % | 2.2 % |
| DB | VVI | Viad Corp | Software - Infrastructure | 60.3 % | 3.3 % |
| SQZ | AGIO | Agios Pharmaceuticals, Inc. | Biotechnology | 59.2 % | 1.6 % |
| *C score is our assessment of a Stock's correlation to CAN SLIM principles. It combines a stock's Technical and Fundamental merits and is expressed as a percentage. | |||||
Breakdowns within 5% of Breakdown Price
| Watchlist | Symbol | Company | Industry | C Score* | % Loss |
|---|---|---|---|---|---|
| SS | MDXG | MiMedx Group, Inc | Biotechnology | 69.5 % | -0.6 % |
| SS | HY | Hyster-Yale, Inc. | Advertising Agencies | 69.2 % | -1 % |
| SS | GPS | Gap, Inc. | Resorts & Casinos | 67.8 % | -4.6 % |
| SS | AFRM | Affirm Holdings, Inc. | Utilities - Regulated Gas | 60.2 % | -4.4 % |
| SS | EOLS | Evolus, Inc. | Packaged Foods | 60.1 % | -0.4 % |
| SS | BV | BrightView Holdings, Inc. | Software - Infrastructure | 56.9 % | -0.5 % |
| SS | IDN | Intellicheck, Inc. | Utilities - Renewable | 55.5 % | -4.5 % |
| SS | JANX | Janux Therapeutics, Inc. | Biotechnology | 54.6 % | -1.5 % |
| SS | RCMT | RCM Technologies, Inc. | Computer Hardware | 52.1 % | -1.8 % |
| SS | RSVR | Reservoir Media, Inc. | Other Precious Metals & Mining | 51.2 % | -0.5 % |
| SS | PBYI | Puma Biotechnology Inc | Biotechnology | 48.5 % | -1.1 % |
| SS | ARVN | Arvinas, Inc. | Biotechnology | 44.9 % | -1.8 % |
| SS | FOSL | Fossil Group, Inc. | Recreational Vehicles | 40.9 % | -4.2 % |
| *C score is our assessment of a Stock's correlation to CAN SLIM principles. It combines a stock's Technical and Fundamental merits and is expressed as a percentage. | |||||
Cup and Handle Chart of the Week
There were no cup and handle stocks meeting our breakout model criteria this week.