Breakoutwatch Weekly Summary 07/25/2024
You are receiving this email because you are or were a
BreakoutWatch.com subscriber, or have subscribed to our weekly
newsletter.
To read this newsletter on the site, click here: Newsletter
.
Market Summary
Investors continue turn to value and small-caps
The major indexes ended mixed in a week that saw a continued rotation in market leadership to small-cap and value shares. The narrowly focused Dow Jones Industrial Average outperformed, and value stocks outpaced growth stocks by 477 basis points (4.77 percentage points), as measured by Russell indexes—the largest divergence since March 2023, when growth shares outperformed by 654 basis points. The week was also notable for a widespread global disruption to computer systems early Friday due to an error in a vendor’s security update to some users of the Microsoft operating system. The problems seemed to have little impact on U.S. trading, however. [more...]
Major Index Performance
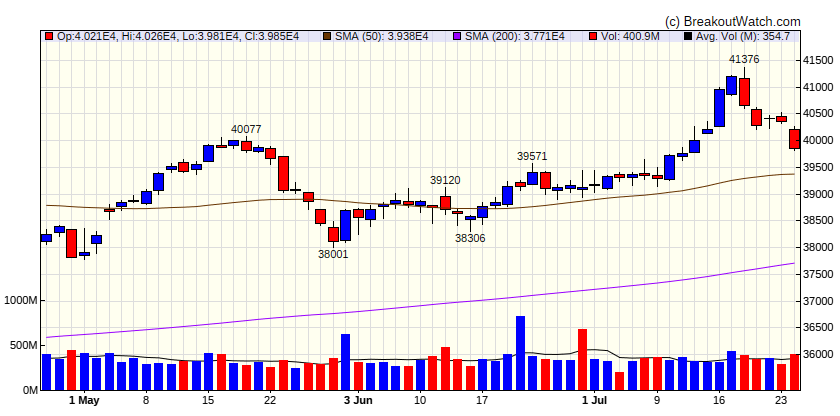
| Dow Jones
|
| Last Close
| 39854 |
| Wk. Gain
| -1.82 % |
| Yr. Gain
| 6.09 % |
| Trend
| Up |
|
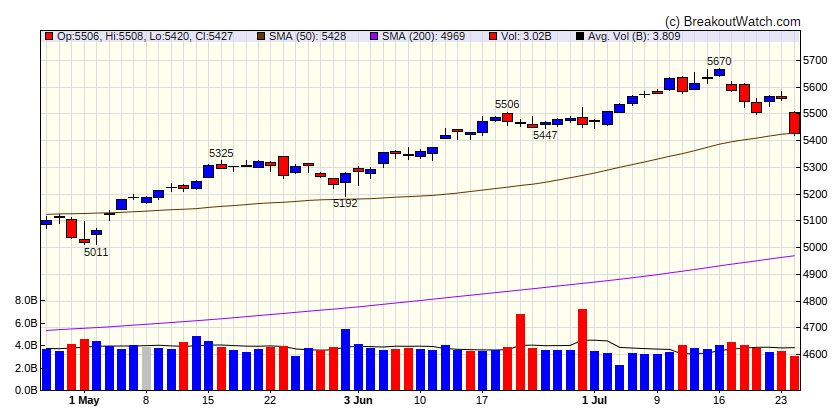
| S&P 500
|
| Last Close
| 5427 |
| Wk. Gain
| -2.09 % |
| Yr. Gain
| 14.37 % |
| Trend
| Down |
|
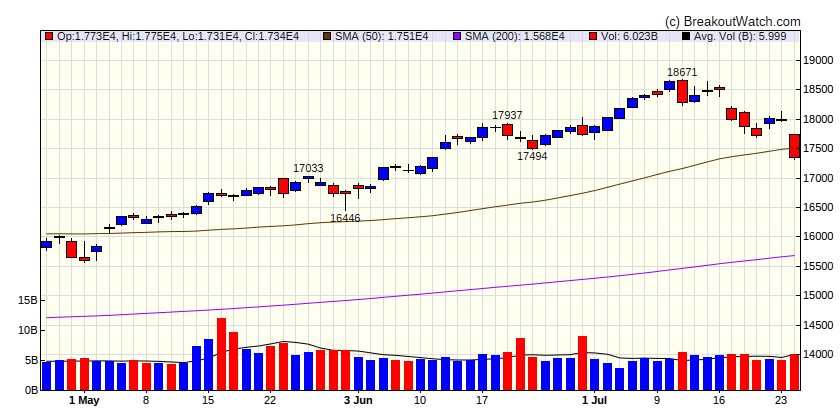
| NASDAQ Comp.
|
| Last Close
| 17342 |
| Wk. Gain
| -2.77 % |
| Yr. Gain
| 16.59 % |
| Trend
| Down |
|
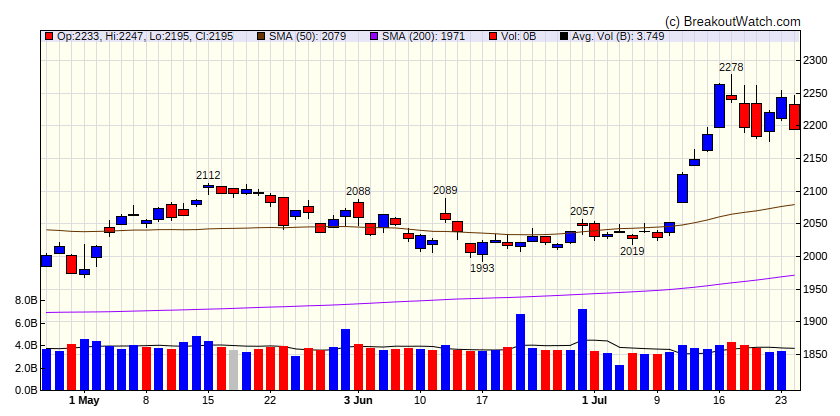
| Russell 2000
|
| Last Close
| 2195 |
| Wk. Gain
| -1.75 % |
| Yr. Gain
| 9.04 % |
| Trend
| Up |
|
Performance by Sector
| Sector |
Wk. Change % |
Yr. Change % |
Trend |
| Consumer Discretionary |
-3.61 |
2.14 |
Down |
| Consumer Staples |
-0.92 |
8.15 |
Up |
| Energy |
-3.03 |
7.51 |
Up |
| Finance |
-1.29 |
13.43 |
Up |
| Health Care |
1.34 |
10.03 |
Up |
| Industrials |
-1.75 |
9.32 |
Up |
| Technology |
-3.09 |
17.21 |
Down |
| Materials |
-1.06 |
4.48 |
Up |
| REIT |
-0.85 |
0.31 |
Up |
| Telecom |
-3.11 |
13.9 |
Down |
| Utilities |
1.21 |
13.43 |
Up |
Breakouts This Week Still Within 5% of Breakout Price (Limit 20 top C Score)
| Watchlist |
Symbol |
Company |
Industry |
C Score* |
% Gain |
| CWH |
AROW |
Arrow Financial Corporation |
Household & Personal Products |
75.5 % |
1.9 % |
| CWH |
GENC |
Gencor Industries, Inc. |
Utilities - Regulated Gas |
74.8 % |
2.8 % |
| CWH |
SRTS |
Sensus Healthcare, Inc. |
Drug Manufacturers - General |
74.3 % |
0.5 % |
| CWH |
IGIC |
International General Insurance Holdings Ltd. |
Confectioners |
74 % |
2.8 % |
| SQZ |
REVG |
REV Group, Inc. |
Telecom Services |
71.1 % |
0.5 % |
| CWH |
CBAN |
Colony Bankcorp, Inc. |
Household & Personal Products |
71 % |
0.3 % |
| SQZ |
DVA |
DaVita Inc. |
Health Information Services |
68.8 % |
1.4 % |
| SQZ |
SQSP |
Squarespace, Inc. |
Utilities - Regulated Gas |
67.8 % |
0.1 % |
| SQZ |
OSPN |
OneSpan Inc. |
Utilities - Regulated Gas |
65 % |
1.4 % |
| CWH |
PRDO |
Perdoceo Education Corporation |
Drug Manufacturers - General |
64.9 % |
0.6 % |
| CWH |
FISI |
Financial Institutions, Inc. |
Household & Personal Products |
62.3 % |
2.8 % |
| SQZ |
NEXT |
NextDecade Corporation |
Household & Personal Products |
56.9 % |
0.7 % |
| SQZ |
JANX |
Janux Therapeutics, Inc. |
Biotechnology |
55.6 % |
1.6 % |
| SQZ |
ELYM |
Eliem Therapeutics, Inc |
Biotechnology |
55.1 % |
4.1 % |
| SQZ |
PEPG |
PepGen Inc. |
Biotechnology |
52.3 % |
3.3 % |
| *C score is our assessment of a Stock's correlation to CAN SLIM principles. It combines a stock's Technical and Fundamental merits and is expressed as a percentage. |
Breakdowns within 5% of Breakdown Price
| Watchlist |
Symbol |
Company |
Industry |
C Score* |
% Loss |
| SS |
CAMT |
Camtek Ltd. |
Utilities - Renewable |
78.4 % |
-4.5 % |
| SS |
SEMR |
SEMrush Holdings, Inc. |
Utilities - Renewable |
72.6 % |
-2 % |
| SS |
RCKY |
Rocky Brands, Inc. |
Biotechnology |
67 % |
-0.3 % |
| SS |
WMS |
Advanced Drainage Systems, Inc. |
Household & Personal Products |
64.2 % |
-2.5 % |
| SS |
MTZ |
MasTec, Inc. |
Advertising Agencies |
57.1 % |
-1.7 % |
| SS |
CRM |
Salesforce, Inc. |
Utilities - Renewable |
55.8 % |
-1.8 % |
| SS |
AXTI |
AXT Inc |
Advertising Agencies |
55.4 % |
-3.4 % |
| SS |
RCMT |
RCM Technologies, Inc. |
Computer Hardware |
54.2 % |
-0.7 % |
| SS |
ARVN |
Arvinas, Inc. |
Biotechnology |
47.3 % |
-0.6 % |
| SS |
FMX |
Fomento Economico Mexicano S.A.B. de C.V. |
Asset Management |
45.7 % |
-2.1 % |
| SS |
CDLX |
Cardlytics, Inc. |
Gold |
37.8 % |
-3.1 % |
| SS |
ATAI |
ATAI Life Sciences N.V. |
Biotechnology |
37 % |
-2.6 % |
| *C score is our assessment of a Stock's correlation to CAN SLIM principles. It combines a stock's Technical and Fundamental merits and is expressed as a percentage. |
| There were no CWH stocks meeting our breakout model criteria |
| *C score is our assessment of a Stock's correlation to CAN SLIM principles. It combines a stock's Technical and Fundamental merits and is expressed as a percentage. |
Cup and Handle Chart of the Week
There were no cup and handle stocks meeting our breakout model criteria this week.