Breakoutwatch Weekly Summary 08/12/2024
You are receiving this email because you are or were a
BreakoutWatch.com subscriber, or have subscribed to our weekly
newsletter.
To read this newsletter on the site, click here: Newsletter
.
Market Summary
Markets volatile on growth worries and technical factors
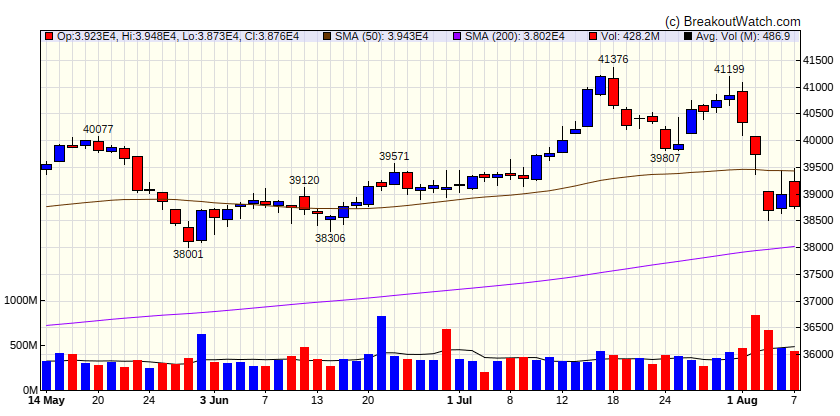
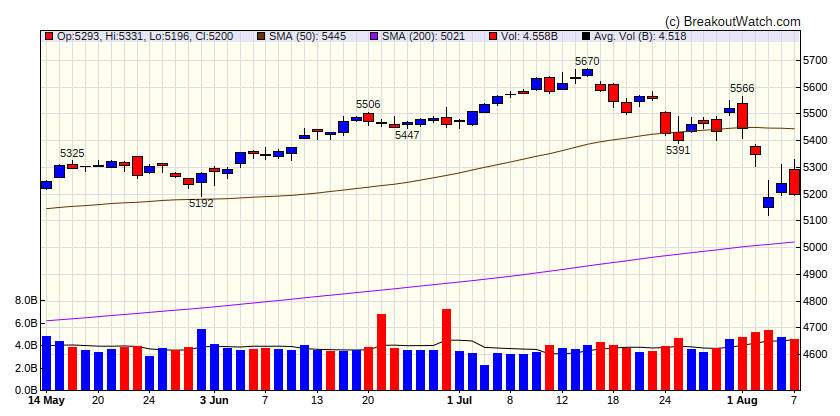
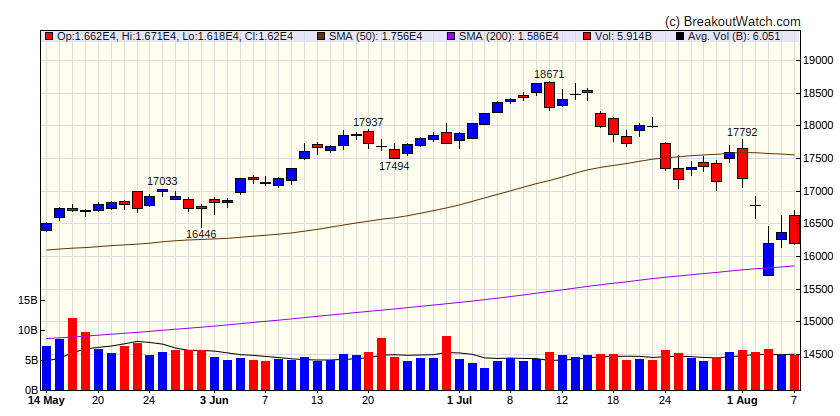
The major indexes closed modestly lower for the week after recovering from the biggest sell-off in nearly two years. The S&P 500 Index neared correction territory (down over 10%) on Monday morning, when it fell as much as 9.71% from its intraday high in mid-January; around the same time, the Nasdaq Composite was down 15.81% from its peak, after entering a correction the previous Friday. Even more pronounced were the swings in the CBOE Volatility Index (VIX), Wall Street’s so-called fear gauge, which briefly spiked Monday to 65.73, its highest level since late March 2020, before falling back to end the week at 20.69. [more...]
Major Index Performance
| Dow Jones
|
| Last Close
| |
| Wk. Gain
| -100 % |
| Yr. Gain
| -100 % |
| Trend
| Down |

|
| S&P 500
|
| Last Close
| |
| Wk. Gain
| -100 % |
| Yr. Gain
| -100 % |
| Trend
| Down |

|
| NASDAQ Comp.
|
| Last Close
| |
| Wk. Gain
| -100 % |
| Yr. Gain
| -100 % |
| Trend
| Down |

|
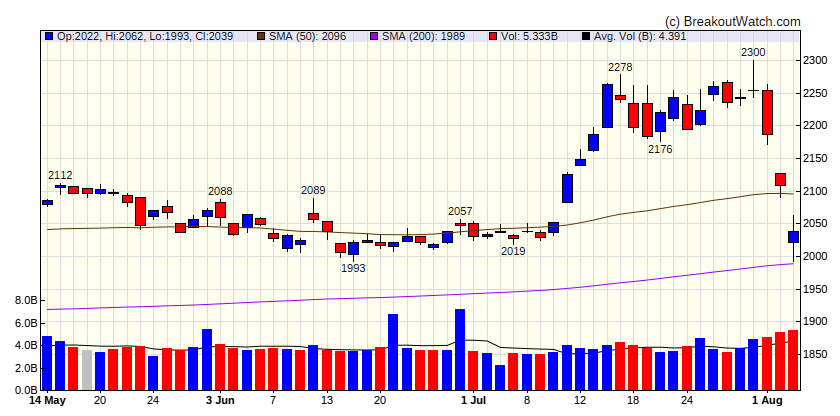
| Russell 2000
|
| Last Close
| |
| Wk. Gain
| -100 % |
| Yr. Gain
| -100 % |
| Trend
| Down |

|
Performance by Sector
| Sector |
Wk. Change % |
Yr. Change % |
Trend |
| Consumer Discretionary |
5.17 |
-1.03 |
Down |
| Consumer Staples |
0.24 |
9.87 |
Up |
| Energy |
3.81 |
5.68 |
Down |
| Finance |
3.56 |
12 |
Down |
| Health Care |
1.65 |
9.92 |
Down |
| Industrials |
3.63 |
8.95 |
Down |
| Technology |
8.21 |
12.06 |
Down |
| Materials |
1.49 |
2.81 |
Down |
| REIT |
1.8 |
3.45 |
Up |
| Telecom |
6.14 |
15.67 |
Down |
| Utilities |
-1.15 |
16.95 |
Up |
Breakouts This Week Still Within 5% of Breakout Price (Limit 20 top C Score)
| Watchlist |
Symbol |
Company |
Industry |
C Score* |
% Gain |
| SQZ |
DECK |
Deckers Outdoor Corporation |
Footwear & Accessories |
69 % |
0.7 % |
| SQZ |
PLNT |
Planet Fitness, Inc. |
Leisure |
68.9 % |
1 % |
| SQZ |
LOCO |
El Pollo Loco Holdings, Inc. |
Restaurants |
68.8 % |
0.5 % |
| CWH |
TRUP |
Trupanion, Inc. |
Insurance - Specialty |
67.4 % |
0.4 % |
| SQZ |
ATMU |
Atmus Filtration Technologies Inc. |
Pollution & Treatment Controls |
66.5 % |
0.4 % |
| CWH |
TGLS |
Tecnoglass Inc. |
Building Materials |
66 % |
0.4 % |
| SQZ |
RXST |
RxSight, Inc. |
Medical Devices |
65.2 % |
2.8 % |
| SQZ |
SNCR |
Synchronoss Technologies, Inc. |
Software - Infrastructure |
63.9 % |
2.6 % |
| SQZ |
SHIP |
Seanergy Maritime Holdings Corp. |
Marine Shipping |
61.6 % |
0.3 % |
| SQZ |
T |
AT&T Inc. |
Telecom Services |
60 % |
1.2 % |
| SQZ |
ENV |
Envestnet, Inc |
Software - Application |
45.8 % |
0.1 % |
| *C score is our assessment of a Stock's correlation to CAN SLIM principles. It combines a stock's Technical and Fundamental merits and is expressed as a percentage. |
Breakdowns within 5% of Breakdown Price
| Watchlist |
Symbol |
Company |
Industry |
C Score* |
% Loss |
| SS |
IP |
International Paper Company |
Packaging & Containers |
65 % |
-1.5 % |
| SS |
MAX |
MediaAlpha, Inc. |
Internet Content & Information |
63.9 % |
-1.3 % |
| SS |
SWBI |
Smith & Wesson Brands, Inc. |
Aerospace & Defense |
56.5 % |
-3.6 % |
| SS |
PYXS |
Pyxis Oncology, Inc. |
Biotechnology |
56.1 % |
-4.4 % |
| SS |
VERA |
Vera Therapeutics, Inc. |
Biotechnology |
54.2 % |
-1.2 % |
| SS |
GIC |
Global Industrial Company |
Industrial Distribution |
46.1 % |
-4.5 % |
| SS |
TNGX |
Tango Therapeutics, Inc. |
Biotechnology |
33.2 % |
-3.7 % |
| *C score is our assessment of a Stock's correlation to CAN SLIM principles. It combines a stock's Technical and Fundamental merits and is expressed as a percentage. |
| There were no CWH stocks meeting our breakout model criteria |
| *C score is our assessment of a Stock's correlation to CAN SLIM principles. It combines a stock's Technical and Fundamental merits and is expressed as a percentage. |
Cup and Handle Chart of the Week
There were no cup and handle stocks meeting our breakout model criteria this week.


