Breakoutwatch Weekly Summary 08/13/2024
You are receiving this email because you are or were a
BreakoutWatch.com subscriber, or have subscribed to our weekly
newsletter.
To read this newsletter on the site, click here: Newsletter
.
Contents
Market Summary
Markets volatile on growth worries and technical factors
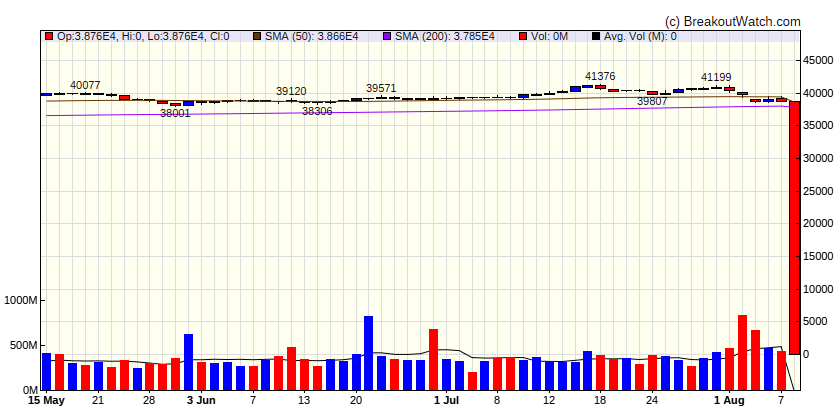
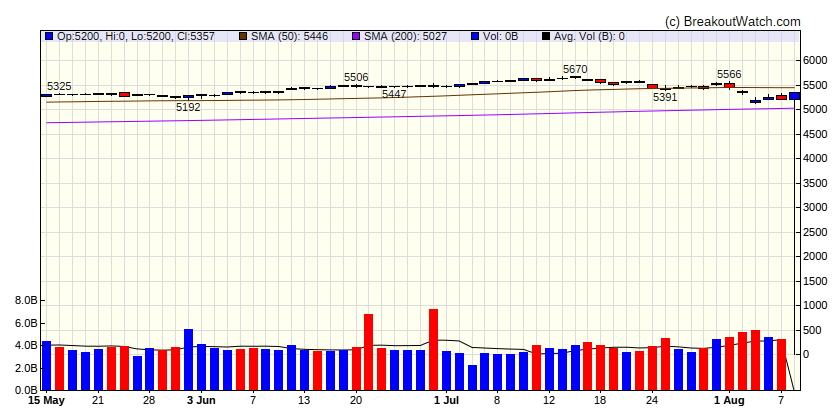
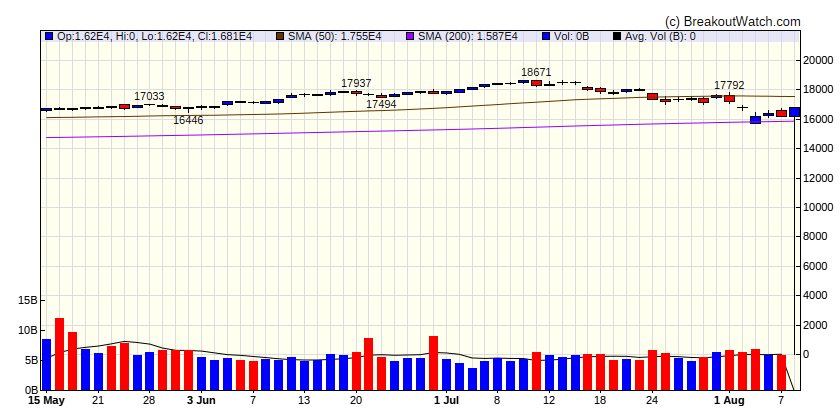
The major indexes closed modestly lower for the week after recovering from the biggest sell-off in nearly two years. The S&P 500 Index neared correction territory (down over 10%) on Monday morning, when it fell as much as 9.71% from its intraday high in mid-January; around the same time, the Nasdaq Composite was down 15.81% from its peak, after entering a correction the previous Friday. Even more pronounced were the swings in the CBOE Volatility Index (VIX), Wall Street’s so-called fear gauge, which briefly spiked Monday to 65.73, its highest level since late March 2020, before falling back to end the week at 20.69. [more...]
Major Index Performance
| Dow Jones | |
|---|---|
| Last Close | 0 |
| Wk. Gain | -100 % |
| Yr. Gain | -100 % |
| Trend | Down |

|
|
| S&P 500 | |
|---|---|
| Last Close | 5356.88 |
| Wk. Gain | 1.21 % |
| Yr. Gain | 12.9 % |
| Trend | Down |

|
|
| NASDAQ Comp. | |
|---|---|
| Last Close | 16807.3 |
| Wk. Gain | 1.11 % |
| Yr. Gain | 13 % |
| Trend | Down |

|
|
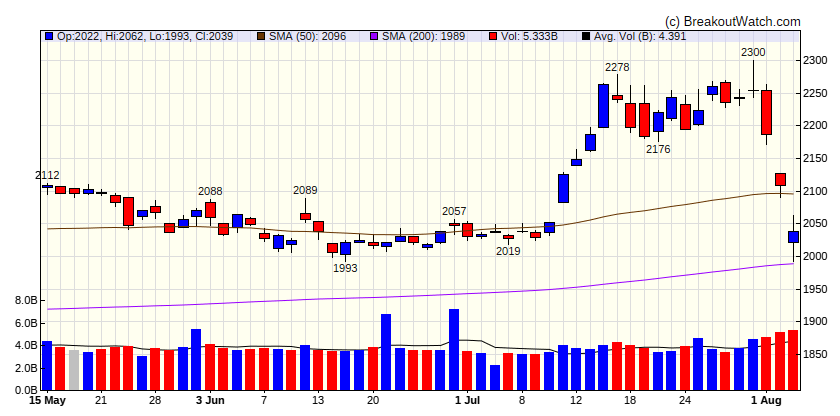
| Russell 2000 | |
|---|---|
| Last Close | 16807.3 |
| Wk. Gain | 13 % |
| Yr. Gain | 734.94 % |
| Trend | Down |

|
|
Performance by Sector
| Sector | Wk. Change % | Yr. Change % | Trend |
|---|---|---|---|
| Consumer Discretionary | -0.73 | -1.62 | Down |
| Consumer Staples | -0.23 | 9.21 | Up |
| Energy | 1.99 | 6.38 | Down |
| Finance | 0.31 | 11.38 | Down |
| Health Care | 1.06 | 9.54 | Down |
| Industrials | -0.05 | 8.45 | Down |
| Technology | 1.4 | 12.64 | Down |
| Materials | -1.31 | 2.31 | Down |
| REIT | -0.43 | 2.69 | Up |
| Telecom | 0.42 | 14.9 | Down |
| Utilities | 0.26 | 17.11 | Up |
Breakouts This Week Still Within 5% of Breakout Price (Limit 20 top C Score)
| Watchlist | Symbol | Company | Industry | C Score* | % Gain |
|---|---|---|---|---|---|
| CWH | TZOO | Travelzoo | Advertising Agencies | 78.2 % | 4.9 % |
| SQZ | BBAR | Banco BBVA Argentina S.A. | Banks - Regional | 70.4 % | 2.1 % |
| SQZ | TGS | Transportadora de Gas del Sur SA TGS | Oil & Gas Integrated | 70.4 % | 2.8 % |
| SQZ | DECK | Deckers Outdoor Corporation | Footwear & Accessories | 70.3 % | 3.1 % |
| SQZ | VZIO | VIZIO Holding Corp. Class A | Consumer Electronics | 69.6 % | 0.4 % |
| SQZ | PLNT | Planet Fitness, Inc. | Leisure | 69.2 % | 0.5 % |
| CWH | TRUP | Trupanion, Inc. | Insurance - Specialty | 67.7 % | 2 % |
| SQZ | SNCR | Synchronoss Technologies, Inc. | Software - Infrastructure | 63.9 % | 0.4 % |
| DB | IRS | IRSA Inversiones Y Representaciones S.A. Global Depositary Shares (Each representing ten shares of | Real Estate Services | 63.6 % | 0.7 % |
| SQZ | SHIP | Seanergy Maritime Holdings Corp. | Marine Shipping | 62.5 % | 0.6 % |
| SQZ | CNTA | Centessa Pharmaceuticals plc | Biotechnology | 61.8 % | 2.5 % |
| SQZ | PHAT | Phathom Pharmaceuticals, Inc. | Biotechnology | 61.5 % | 2.3 % |
| SQZ | MTZ | MasTec, Inc. | Engineering & Construction | 61.2 % | 0 % |
| SQZ | T | AT&T Inc. | Telecom Services | 60.5 % | 0.9 % |
| SQZ | LOAR | Loar Holdings Inc. | Aerospace & Defense | 60.2 % | 1.4 % |
| SQZ | ENV | Envestnet, Inc | Software - Application | 59 % | 0 % |
| SQZ | FULC | Fulcrum Therapeutics, Inc. | Biotechnology | 58.9 % | 1.6 % |
| SQZ | ZIM | ZIM Integrated Shipping S | Marine Shipping | 57.3 % | 1.6 % |
| *C score is our assessment of a Stock's correlation to CAN SLIM principles. It combines a stock's Technical and Fundamental merits and is expressed as a percentage. | |||||
Breakdowns within 5% of Breakdown Price
| Watchlist | Symbol | Company | Industry | C Score* | % Loss |
|---|---|---|---|---|---|
| SS | FIX | Comfort Systems USA, Inc. | Engineering & Construction | 72.5 % | -0.1 % |
| SS | MAX | MediaAlpha, Inc. | Internet Content & Information | 65.4 % | -1 % |
| SS | IP | International Paper Company | Packaging & Containers | 65.1 % | -1.2 % |
| SS | SWBI | Smith & Wesson Brands, Inc. | Aerospace & Defense | 59.2 % | -4.3 % |
| SS | FNKO | Funko, Inc. | Leisure | 57.7 % | -0.8 % |
| SS | PYXS | Pyxis Oncology, Inc. | Biotechnology | 57.3 % | -2 % |
| SS | VERA | Vera Therapeutics, Inc. | Biotechnology | 54.5 % | -1.5 % |
| SS | MYO | Myomo Inc. | Medical Devices | 52.4 % | -3.3 % |
| SS | TNGX | Tango Therapeutics, Inc. | Biotechnology | 38.3 % | -3.7 % |
| SS | OLMA | Olema Pharmaceuticals, Inc. | Biotechnology | 31.6 % | -4.9 % |
| *C score is our assessment of a Stock's correlation to CAN SLIM principles. It combines a stock's Technical and Fundamental merits and is expressed as a percentage. | |||||
Cup and Handle Stocks Likely to Breakout next Week
| Symbol | BoP | Company | Industry | Relative Strength Rank | Within x% of BoP | C Score* |
|---|---|---|---|---|---|---|
| PRAX | 59.81 | Praxis Precision Medicines, Inc. | Biotechnology | 99.00 | 86.64 | 62.5 |
| VIRC | 18.05 | Virco Manufacturing Corporation | Furnishings, Fixtures & Appliances | 96.00 | 82.6 | 74.9 |
| SIGA | 10.70 | SIGA Technologies Inc. | Drug Manufacturers - Specialty & Generic | 94.00 | 85.79 | 80.4 |
| REVG | 29.89 | REV Group, Inc. | Farm & Heavy Construction Machinery | 93.00 | 94.61 | 74.3 |
| NVEI | 33.26 | Nuvei Corporation | Software - Infrastructure | 91.00 | 99.49 | 63.6 |
| TEVA | 18.03 | Teva Pharmaceutical Indus | Drug Manufacturers - Specialty & Generic | 91.00 | 94.73 | 59.3 |
| DNTH | 31.61 | Dianthus Therapeutics, Inc. | Biotechnology | 91.00 | 83.74 | 66.4 |
| FFNW | 22.48 | First Financial Northwest, Inc. | Banks - Regional | 90.00 | 96.8 | 60.6 |
| FLXS | 38.95 | Flexsteel Industries, Inc. | Furnishings, Fixtures & Appliances | 89.00 | 88.4 | 76.2 |
| SA | 16.98 | Seabridge Gold, Inc. | Gold | 89.00 | 97.29 | 58.3 |
| PRIM | 57.72 | Primoris Services Corporation | Engineering & Construction | 89.00 | 90.63 | 68.7 |
| OSPN | 15.99 | OneSpan Inc. | Software - Infrastructure | 89.00 | 92.37 | 68.1 |
| MDGL | 298.00 | Madrigal Pharmaceuticals, Inc. | Biotechnology | 89.00 | 81.24 | 47.8 |
| TILE | 17.86 | Interface, Inc. | Building Products & Equipment | 88.00 | 91.32 | 70.6 |
| CYBR | 284.10 | CyberArk Software Ltd. | Software - Infrastructure | 88.00 | 95.35 | 72.4 |
| LFVN | 8.75 | Lifevantage Corporation | Packaged Foods | 88.00 | 89.83 | 62.8 |
| ARIS | 17.91 | Aris Water Solutions, Inc. | Utilities - Regulated Water | 87.00 | 83.81 | 70.6 |
| VCYT | 30.86 | Veracyte, Inc. | Diagnostics & Research | 87.00 | 96.95 | 68.3 |
| PHG | 29.53 | Koninklijke Philips N.V. | Medical Devices | 86.00 | 96 | 56.4 |
| RYTM | 53.92 | Rhythm Pharmaceuticals, Inc. | Biotechnology | 86.00 | 82.49 | 64 |
| QNST | 20.50 | QuinStreet, Inc. | Advertising Agencies | 85.00 | 83.46 | 54.7 |
| COLL | 39.58 | Collegium Pharmaceutical, Inc. | Drug Manufacturers - Specialty & Generic | 85.00 | 89.99 | 68.8 |
| IOT | 39.21 | Samsara Inc. | Software - Infrastructure | 84.00 | 97.37 | 67.9 |
| DASH | 126.37 | DoorDash, Inc. | Internet Content & Information | 84.00 | 98.16 | 60.6 |
| SPR | 37.08 | Spirit Aerosystems Holdings, Inc. | Aerospace & Defense | 84.00 | 91.29 | 60.5 |
| GE | 177.20 | GE Aerospace | Aerospace & Defense | 83.00 | 94.17 | 69.9 |
| KTB | 73.31 | Kontoor Brands, Inc. | Apparel Manufacturing | 82.00 | 95.27 | 65.7 |
| PRG | 46.40 | PROG Holdings, Inc. | Rental & Leasing Services | 82.00 | 86.9 | 60.5 |
| GSHD | 92.50 | Goosehead Insurance, Inc. | Insurance - Diversified | 82.00 | 88.36 | 74.5 |
| EOLS | 14.41 | Evolus, Inc. | Drug Manufacturers - Specialty & Generic | 81.00 | 90.56 | 68.2 |
| TSEM | 44.18 | Tower Semiconductor Ltd. | Semiconductors | 81.00 | 86.17 | 61.1 |
| FTNT | 71.82 | Fortinet, Inc. | Software - Infrastructure | 81.00 | 97.97 | 63.5 |
| EZPW | 11.66 | EZCORP, Inc. | Credit Services | 81.00 | 98.46 | 63.1 |
| SKY | 86.81 | Skyline Champion Corporation | Residential Construction | 80.00 | 96.88 | 72.2 |
| BWXT | 106.42 | BWX Technologies, Inc. | Aerospace & Defense | 80.00 | 91.37 | 71.2 |
| SAFE | 23.76 | Safehold Inc. | REIT - Diversified | 80.00 | 96.17 | 62.3 |
| ASTL | 10.00 | Algoma Steel Group Inc. | Steel | 80.00 | 89 | 66 |
| *C score is our assessment of a Stock's correlation to CAN SLIM principles. It combines a stock's Technical and Fundamental merits and is expressed as a percentage. | ||||||
Cup and Handle Chart of the Week
There were no cup and handle stocks meeting our breakout model criteria this week.