Breakoutwatch Weekly Summary 10/21/2024
You are receiving this email because you are or were a
BreakoutWatch.com subscriber, or have subscribed to our weekly
newsletter.
To read this newsletter on the site, click here: Newsletter
.
Contents
Market Summary
U.S. Treasuries eke out marginal gains; heavy issuance in bank loan market
The S&P 500 Index advanced, paced by the utilities and real estate sectors. Energy stocks pulled back in sympathy with oil prices, which retreated as fears of possible Israeli attacks on Iran’s oil and gas infrastructure subsided. Returns were stronger down the market cap spectrum, with the small-cap Russell 2000 Index and the S&P MidCap 400 Index outperforming. [more...]
Major Index Performance
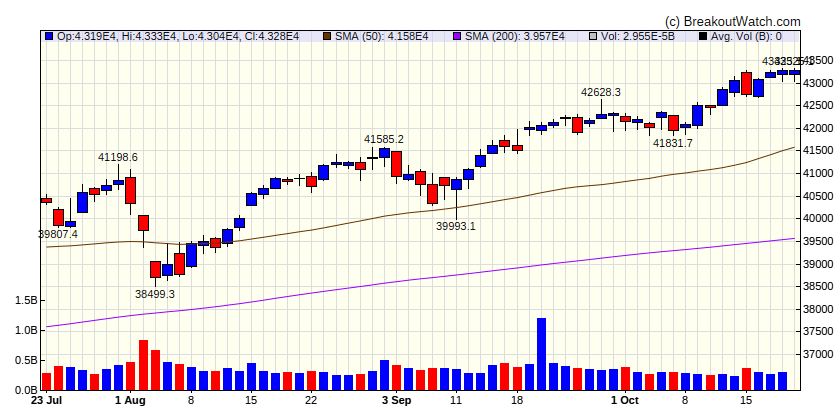
| Dow Jones | |
|---|---|
| Last Close | 43275.9 |
| Wk. Gain | 1.33 % |
| Yr. Gain | 15.2 % |
| Trend | Up |
|
|
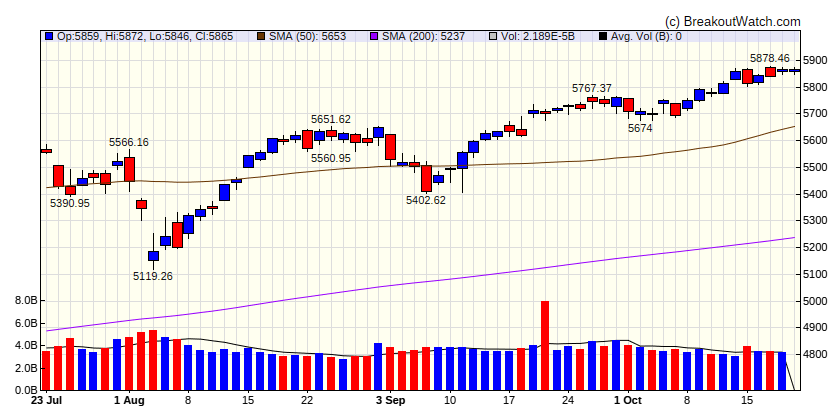
| S&P 500 | |
|---|---|
| Last Close | 5864.67 |
| Wk. Gain | 0.83 % |
| Yr. Gain | 23.59 % |
| Trend | Up |
|
|
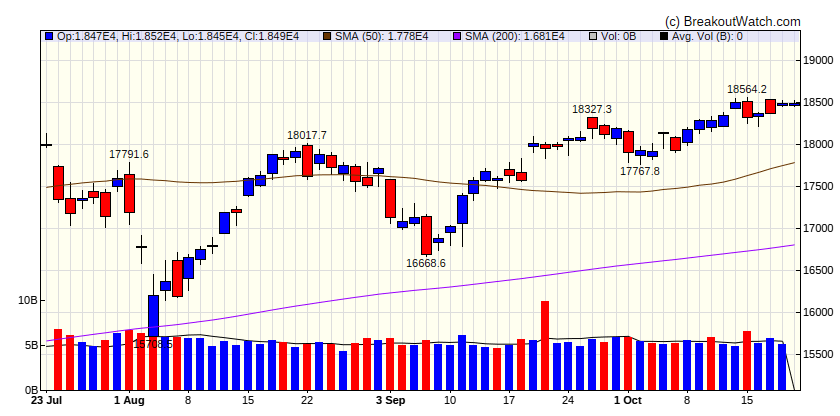
| NASDAQ Comp. | |
|---|---|
| Last Close | 18489.6 |
| Wk. Gain | 0.85 % |
| Yr. Gain | 24.31 % |
| Trend | Up |
|
|
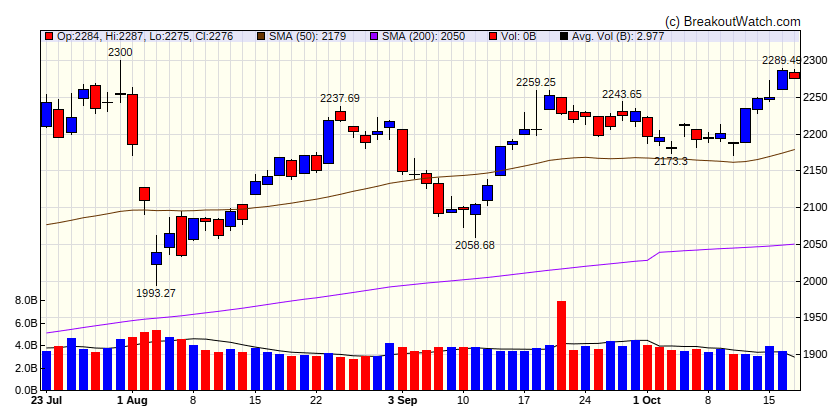
| Russell 2000 | |
|---|---|
| Last Close | 18489.6 |
| Wk. Gain | 718.07 % |
| Yr. Gain | 818.62 % |
| Trend | Up |
|
|
Performance by Sector
| Sector | Wk. Change % | Yr. Change % | Trend |
|---|---|---|---|
| Consumer Discretionary | 5428.03 | 5999.76 | Down |
| Consumer Staples | 9608.37 | 9526.49 | Up |
| Energy | 15057.89 | 23677.78 | Up |
| Finance | 18924.18 | 25197.03 | Up |
| Health Care | 8201.35 | 9501.5 | Up |
| Industrials | 11847.27 | 12703.55 | Up |
| Technology | 8338.12 | 8338.12 | Up |
| Materials | 14773.78 | 14773.78 | Up |
| REIT | 19749.28 | 19749.28 | Up |
| Telecom | 21103.67 | 21103.67 | Up |
| Utilities | 13005.76 | 13005.76 | Up |
Breakouts This Week Still Within 5% of Breakout Price (Limit 20 top C Score)
| Watchlist | Symbol | Company | Industry | C Score* | % Gain |
|---|---|---|---|---|---|
| *C score is our assessment of a Stock's correlation to CAN SLIM principles. It combines a stock's Technical and Fundamental merits and is expressed as a percentage. | |||||
Breakdowns within 5% of Breakdown Price
| Watchlist | Symbol | Company | Industry | C Score* | % Loss | There were no Breakdowns still within 5% of breakdown price this week |
|---|---|---|---|---|---|
| *C score is our assessment of a Stock's correlation to CAN SLIM principles. It combines a stock's Technical and Fundamental merits and is expressed as a percentage. | |||||
Cup and Handle Stocks Likely to Breakout next Week
| Symbol | BoP | Company | Industry | Relative Strength Rank | Within x% of BoP | C Score* |
|---|---|---|---|---|---|---|
| PTCT | 41.81 | PTC Therapeutics, Inc. | Biotechnology | 0.00 | 93.52 | 30.7 |
| VFC | 21.40 | V.F. Corporation | Leisure | 0.00 | 91.59 | 25 |
| VERA | 47.30 | Vera Therapeutics, Inc. | Biotechnology | 0.00 | 87.02 | 5.2 |
| SNFCA | 9.94 | Security National Financial Corporation | Farm Products | 0.00 | 98.49 | 32.4 |
| SHAK | 113.50 | Shake Shack, Inc. | Residential Construction | 0.00 | 97.13 | 8.2 |
| SG | 39.75 | Sweetgreen, Inc. | Residential Construction | 0.00 | 88.73 | 8.3 |
| S | 27.12 | SentinelOne, Inc. | Utilities - Regulated Gas | 0.00 | 97.2 | 6.1 |
| RVMD | 51.00 | Revolution Medicines, Inc. | Biotechnology | 0.00 | 98.88 | 5.9 |
| RGS | 29.28 | Regis Corporation | Apparel Manufacturing | 0.00 | 90.16 | 29.2 |
| APGE | 60.82 | Apogee Therapeutics, Inc. | Biotechnology | 0.00 | 88.01 | 9.5 |
| OSPN | 16.68 | OneSpan Inc. | Utilities - Regulated Gas | 0.00 | 92.15 | 33.7 |
| MHK | 162.40 | Mohawk Industries, Inc. | Packaged Foods | 0.00 | 99.17 | 31.1 |
| LEE | 16.49 | Lee Enterprises, Inco | Other Industrial Metals & Mining | 0.00 | 86.96 | 16.1 |
| KNSA | 27.18 | Kiniksa Pharmaceuticals, Ltd. | Biotechnology | 0.00 | 96.62 | 7.4 |
| IMAX | 21.84 | Imax Corporation | Other Precious Metals & Mining | 0.00 | 96.89 | 31.1 |
| FTNT | 83.77 | Fortinet, Inc. | Utilities - Regulated Gas | 0.00 | 96.78 | 35.4 |
| DDI | 16.75 | DoubleDown Interactive Co., Ltd. | Utilities - Diversified | 0.00 | 87.28 | 6.3 |
| *C score is our assessment of a Stock's correlation to CAN SLIM principles. It combines a stock's Technical and Fundamental merits and is expressed as a percentage. | ||||||
Cup and Handle Chart of the Week
There were no cup and handle stocks meeting our breakout model criteria this week.