Breakoutwatch Weekly Summary 10/31/2024
You are receiving this email because you are or were a
BreakoutWatch.com subscriber, or have subscribed to our weekly
newsletter.
To read this newsletter on the site, click here: Newsletter
.
Contents
Market Summary
Stocks take cues from increasing U.S. Treasury yields
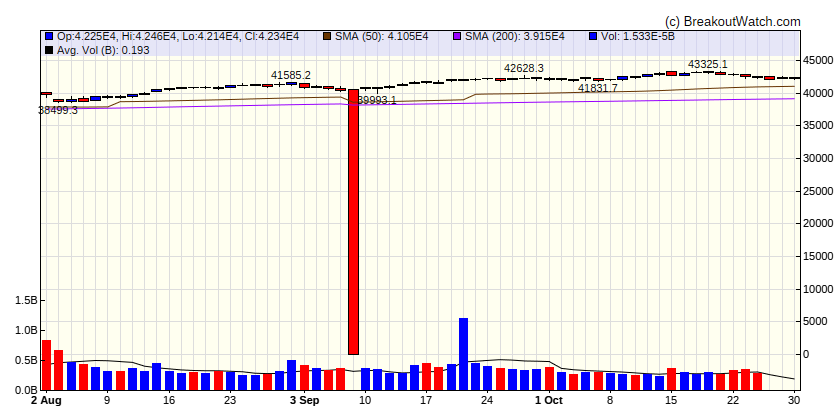
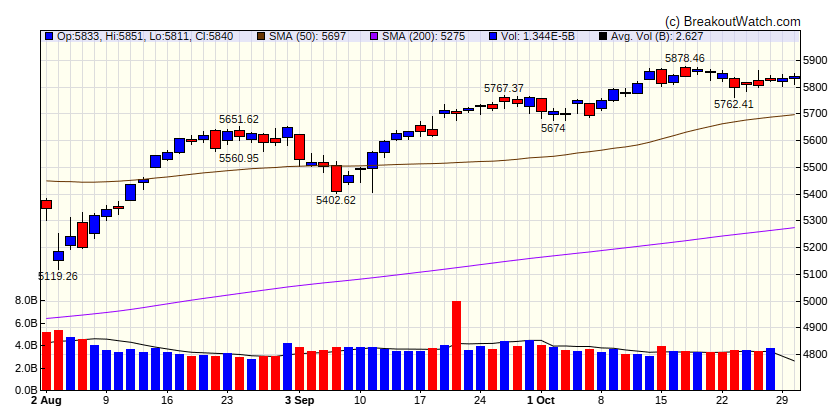
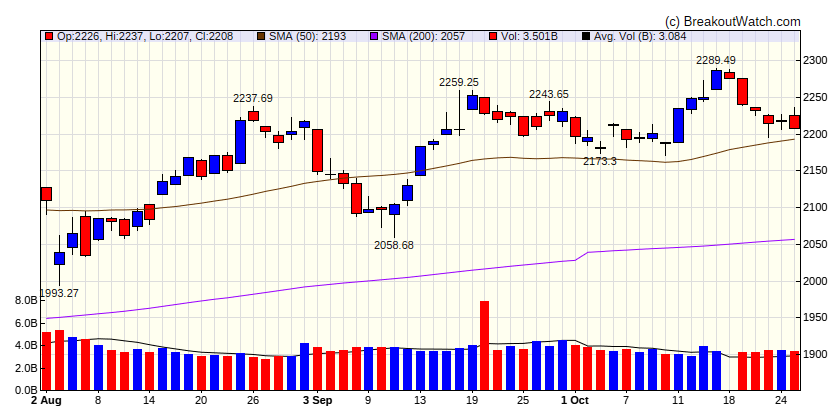
The broad market S&P 500 Index finished lower after posting gains in each of the six previous weeks. Equities seemed to take cues from the U.S. Treasury market, where futures market pricing now reflects a shallower Fed rate-cutting cycle. Large-cap stocks held up better than small-caps, and growth stocks outperformed value as the tech-heavy Nasdaq Composite Index gained slightly. [more...]
Major Index Performance
| Dow Jones | |
|---|---|
| Last Close | 42340.4 |
| Wk. Gain | -0.32 % |
| Yr. Gain | 12.71 % |
| Trend | Down |

|
|
| S&P 500 | |
|---|---|
| Last Close | 5839.77 |
| Wk. Gain | 0.22 % |
| Yr. Gain | 23.07 % |
| Trend | Up |

|
|
| NASDAQ Comp. | |
|---|---|
| Last Close | 5839.77 |
| Wk. Gain | 23.07 % |
| Yr. Gain | 23.07 % |
| Trend | Down |

|
|
| Russell 2000 | |
|---|---|
| Last Close | 5839.77 |
| Wk. Gain | 23.07 % |
| Yr. Gain | 190.14 % |
| Trend | Up |

|
|
Performance by Sector
| Sector | Wk. Change % | Yr. Change % | Trend |
|---|---|---|---|
| Consumer Discretionary | -0.11 | 11.64 | Up |
| Consumer Staples | -1.69 | 11.69 | Down |
| Energy | -2.29 | 4.3 | Down |
| Finance | -0.18 | 25.21 | Up |
| Health Care | -0.97 | 9.08 | Down |
| Industrials | -0.51 | 19.14 | Down |
| Technology | 0.07 | 26.01 | Up |
| Materials | -0.17 | 10.64 | Down |
| REIT | -1.58 | 8.77 | Up |
| Telecom | 2.51 | 28.31 | Up |
| Utilities | -3.31 | 24.97 | Down |
Breakouts This Week Still Within 5% of Breakout Price (Limit 20 top C Score)
| Watchlist | Symbol | Company | Industry | C Score* | % Gain |
|---|---|---|---|---|---|
| SQZ | BCRX | BioCryst Pharmaceuticals, Inc. | Biotechnology | 70.2 % | 3.7 % |
| CWH | LGND | Ligand Pharmaceuticals Inco | Biotechnology | 69.3 % | 0.4 % |
| SQZ | APEI | American Public Education, Inc. | Advertising Agencies | 65.4 % | 4.4 % |
| CWH | SNFCA | Security National Financial Corporation | Farm Products | 63.7 % | 0.9 % |
| SQZ | IOVA | Iovance Biotherapeutics, Inc. | Biotechnology | 62.8 % | 3.4 % |
| SQZ | PBI | Pitney Bowes Inc. | Household & Personal Products | 62.7 % | 4.1 % |
| SQZ | AORT | Artivion, Inc. | Drug Manufacturers - General | 62.5 % | 0.6 % |
| CWH | TEVA | Teva Pharmaceutical Indus | Biotechnology | 55.1 % | 0.2 % |
| SQZ | LUMN | Lumen Technologies, Inc. | Specialty Chemicals | 54.9 % | 4.2 % |
| CWH | MCS | Marcus Corporation (The) | Other Precious Metals & Mining | 51.8 % | 2.6 % |
| SQZ | APLT | Applied Therapeutics, Inc. | Biotechnology | 43.5 % | 4.5 % |
| CWH | KVYO | Klaviyo, Inc. | Utilities - Regulated Gas | 41 % | 0.3 % |
| SQZ | IGMS | IGM Biosciences, Inc. | Biotechnology | 40.2 % | 4.5 % |
| SQZ | ALHC | Alignment Healthcare, Inc. | Diagnostics & Research | 39.8 % | 1.6 % |
| SQZ | PHAT | Phathom Pharmaceuticals, Inc. | Biotechnology | 39.1 % | 0.8 % |
| SQZ | VCYT | Veracyte, Inc. | Biotechnology | 38.9 % | 2.5 % |
| CWH | MAX | MediaAlpha, Inc. | Packaged Foods | 38.5 % | 0.1 % |
| SQZ | FYBR | Frontier Communications Parent, Inc. | Specialty Chemicals | 38.4 % | 0.1 % |
| SQZ | CTRE | CareTrust REIT, Inc. | Oil & Gas Refining & Marketing | 38.1 % | 4.8 % |
| SQZ | GKOS | Glaukos Corporation | Drug Manufacturers - General | 37.9 % | 3.4 % |
| *C score is our assessment of a Stock's correlation to CAN SLIM principles. It combines a stock's Technical and Fundamental merits and is expressed as a percentage. | |||||
Breakdowns within 5% of Breakdown Price
| Watchlist | Symbol | Company | Industry | C Score* | % Loss |
|---|---|---|---|---|---|
| SS | LPX | Louisian | Biotechnology | 71.5 % | -2.2 % |
| SS | MOD | Modine Manufacturing Company | Specialty Retail | 71.3 % | -1.5 % |
| SS | CAMT | Camtek Ltd. | Utilities - Renewable | 67.6 % | -0.4 % |
| SS | SRPT | Sarepta Therapeutics, Inc. | Biotechnology | 58.6 % | -0.8 % |
| SS | CMG | Chipotle Mexican Grill, Inc. | Residential Construction | 55.5 % | -1.7 % |
| SS | CLFD | Clearfield, Inc. | Utilities - Regulated Water | 50.6 % | -4.6 % |
| SS | DPZ | Domino's Pizza Inc | Residential Construction | 48.6 % | -2.6 % |
| *C score is our assessment of a Stock's correlation to CAN SLIM principles. It combines a stock's Technical and Fundamental merits and is expressed as a percentage. | |||||
Cup and Handle Stocks Likely to Breakout next Week
| Symbol | BoP | Company | Industry | Relative Strength Rank | Within x% of BoP | C Score* |
|---|---|---|---|---|---|---|
| VKTX | 81.73 | Viking Therapeutics, Inc. | Biotechnology | 97.00 | 87.79 | 37.9 |
| SPRY | 17.08 | ARS Pharmaceuticals, Inc. | Biotechnology | 96.00 | 83.55 | 40.2 |
| DCTH | 11.66 | Delcath Systems, Inc. | Drug Manufacturers - General | 95.00 | 89.62 | 68.4 |
| APGE | 60.82 | Apogee Therapeutics, Inc. | Biotechnology | 93.00 | 90.27 | 38 |
| COGT | 12.61 | Cogent Biosciences, Inc. | Biotechnology | 93.00 | 95.24 | 39.8 |
| VERA | 50.00 | Vera Therapeutics, Inc. | Biotechnology | 93.00 | 81.28 | 37.5 |
| BV | 17.05 | BrightView Holdings, Inc. | Software - Infrastructure | 92.00 | 97.83 | 39.2 |
| CLPR | 6.90 | Clipper Realty Inc. | Thermal Coal | 91.00 | 97.54 | 43.1 |
| AVAV | 227.18 | AeroVironment, Inc. | Household & Personal Products | 90.00 | 95.34 | 72.7 |
| CENX | 19.34 | Century Aluminum Company | Publishing | 90.00 | 91.26 | 57.1 |
| DESP | 15.21 | Despegar.com, Corp. Ordin | Textile Manufacturing | 90.00 | 95.33 | 40.3 |
| LNTH | 117.47 | Lantheus Holdings, Inc. | Specialty Business Services | 89.00 | 93.11 | 39.9 |
| HIPO | 20.00 | Hippo Holdings Inc. | Discount Stores | 89.00 | 93.75 | 35.9 |
| PM | 133.27 | Philip Morris International Inc | Insurance - Diversified | 87.00 | 99.13 | 61 |
| DDI | 16.75 | DoubleDown Interactive Co., Ltd. | Utilities - Diversified | 87.00 | 84.48 | 36.7 |
| UTHR | 377.03 | United Therapeutics Corporation | Biotechnology | 86.00 | 95.85 | 71.6 |
| VIST | 54.00 | Vista Energy S.A.B. de C. | Utilities - Regulated Water | 86.00 | 93.89 | 36.2 |
| WIX | 179.00 | Wix.com Ltd. | Utilities - Regulated Gas | 86.00 | 93.79 | 37.3 |
| CINT | 7.60 | CI&T Inc | Utilities - Regulated Gas | 86.00 | 89.47 | 35.1 |
| OPY | 59.06 | Oppenheimer Holdings, Inc. | Beverages - Non-Alcoholic | 85.00 | 97.16 | 61.4 |
| MASI | 146.81 | Masimo Corporation | Drug Manufacturers - General | 83.00 | 97.33 | 58.2 |
| AA | 42.95 | Alcoa Corporation | Publishing | 83.00 | 94.44 | 36.6 |
| KROS | 62.68 | Keros Therapeutics, Inc. | Biotechnology | 82.00 | 95.15 | 36.7 |
| FTNT | 83.77 | Fortinet, Inc. | Utilities - Regulated Gas | 82.00 | 94 | 63.9 |
| EBC | 17.49 | Eastern Bankshares, Inc. | Household & Personal Products | 82.00 | 95.08 | 37.4 |
| SHOP | 84.37 | Shopify Inc. | Utilities - Renewable | 81.00 | 94.83 | 37.2 |
| RBB | 24.50 | RBB Bancorp | Household & Personal Products | 80.00 | 93.88 | 36.1 |
| SQ | 75.00 | Block, Inc. | Utilities - Regulated Gas | 80.00 | 97.72 | 35.4 |
| SRAD | 13.20 | Sportradar Group AG | Utilities - Renewable | 80.00 | 96.21 | 37.4 |
| TSLA | 273.54 | Tesla, Inc. | Auto Parts | 80.00 | 94.15 | 36.8 |
| ITRI | 110.95 | Itron, Inc. | Biotechnology | 80.00 | 93.61 | 66.4 |
| *C score is our assessment of a Stock's correlation to CAN SLIM principles. It combines a stock's Technical and Fundamental merits and is expressed as a percentage. | ||||||
Cup and Handle Chart of the Week
There were no cup and handle stocks meeting our breakout model criteria this week.