Breakoutwatch Weekly Summary 11/09/2024
You are receiving this email because you are or were a
BreakoutWatch.com subscriber, or have subscribed to our weekly
newsletter.
To read this newsletter on the site, click here: Newsletter
.
Contents
Market Summary
Stocks rally on growth and tax hopes following election
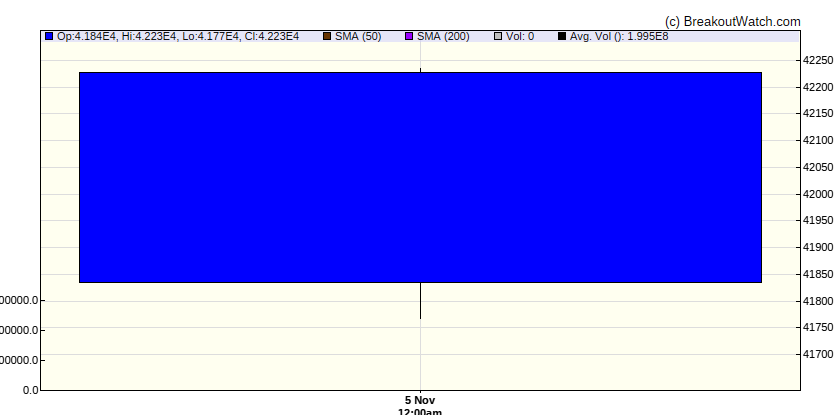
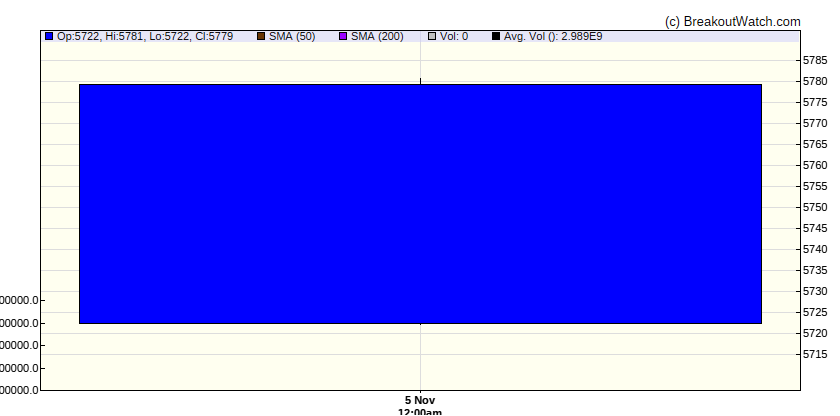
Most of the major benchmarks rose to record highs, as investors wagered that the Republicans’ capture of the White House and Senate, along with their expected retention of the House of Representatives—a so-called red sweep—would result in faster earnings growth, looser regulations, and lower corporate taxes. The small-cap Russell 2000 Index led the gains, surging 8.57% for the week, but was the sole benchmark to remain out of record territory—ending the week down 2.41% from its November 2021 record high. Meanwhile, the S&P 500 Index’s 4.66% gain was its best in almost exactly a year (the week ended November 3, 2023). [more...]
Major Index Performance
| Dow Jones | |
|---|---|
| Last Close | |
| Wk. Gain | -100 % |
| Yr. Gain | -100 % |
| Trend | Down |

|
|
| S&P 500 | |
|---|---|
| Last Close | |
| Wk. Gain | -100 % |
| Yr. Gain | -100 % |
| Trend | Down |

|
|
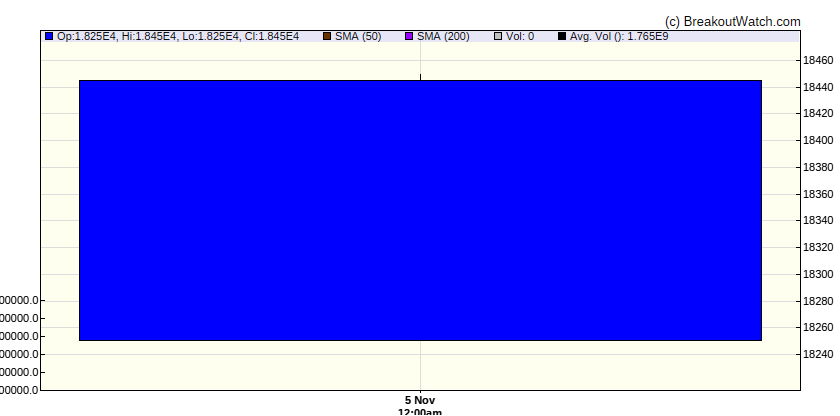
| NASDAQ Comp. | |
|---|---|
| Last Close | |
| Wk. Gain | -100 % |
| Yr. Gain | -100 % |
| Trend | Down |

|
|
| Russell 2000 | |
|---|---|
| Last Close | |
| Wk. Gain | -100 % |
| Yr. Gain | -100 % |
| Trend | Down |

|
|
Performance by Sector
| Sector | Wk. Change % | Yr. Change % | Trend |
|---|---|---|---|
| Consumer Discretionary | 8.01 | 20.09 | Up |
| Consumer Staples | 1.68 | 13.55 | Down |
| Energy | 6.2 | 11.28 | Up |
| Finance | 6.51 | 31.37 | Up |
| Health Care | 2.38 | 11.12 | Down |
| Industrials | 6.44 | 25.77 | Up |
| Technology | 6.4 | 30.64 | Up |
| Materials | 2.06 | 11.91 | Down |
| REIT | 2.64 | 8.9 | Down |
| Telecom | 3.78 | 31.82 | Up |
| Utilities | 2.36 | 25.27 | Down |
Breakouts This Week Still Within 5% of Breakout Price (Limit 20 top C Score)
| Watchlist | Symbol | Company | Industry | C Score* | % Gain |
|---|---|---|---|---|---|
| CWH | INBK | First Internet Bancorp | Household & Personal Products | 73.9 % | 3.3 % |
| CWH | LGND | Ligand Pharmaceuticals Inco | Biotechnology | 68.4 % | 5 % |
| CWH | STKL | SunOpta, Inc. | Insurance - Specialty | 66.5 % | 3.6 % |
| DB | COST | Costco Wholesale Corporation | Insurance Brokers | 65.6 % | 3.7 % |
| CWH | GME | GameStop Corporation | Footwear & Accessories | 63.8 % | 1.4 % |
| SQZ | PBI | Pitney Bowes Inc. | Household & Personal Products | 62.7 % | 1.2 % |
| SQZ | AORT | Artivion, Inc. | Drug Manufacturers - General | 62.1 % | 4.5 % |
| CWH | ATRC | AtriCure, Inc. | Biotechnology | 61.4 % | 2.3 % |
| HTF | TVTX | Travere Therapeutics, Inc. | Biotechnology | 42.8 % | 3.1 % |
| CWH | AKRO | Akero Therapeutics, Inc. | Biotechnology | 41.3 % | 4.6 % |
| CWH | MP | MP Materials Corp. | Gold | 40.8 % | 0.4 % |
| SQZ | FHTX | Foghorn Therapeutics Inc. | Biotechnology | 40.3 % | 4.5 % |
| SQZ | ZVRA | Zevra Therapeutics, Inc. | Biotechnology | 39.9 % | 4.4 % |
| SQZ | APGE | Apogee Therapeutics, Inc. | Biotechnology | 39.5 % | 4.8 % |
| SQZ | BALY | Bally's Corporation | Entertainment | 39.1 % | 0.8 % |
| SQZ | CNTA | Centessa Pharmaceuticals plc | Biotechnology | 39.1 % | 3.1 % |
| SQZ | KYMR | Kymera Therapeutics, Inc. | Biotechnology | 38.7 % | 3 % |
| SQZ | DELL | Dell Technologies Inc. | Utilities - Diversified | 38.5 % | 3.4 % |
| SQZ | STOK | Stoke Therapeutics, Inc. | Biotechnology | 38.2 % | 4.5 % |
| HTF | S | SentinelOne, Inc. | Utilities - Regulated Gas | 38.1 % | 2.9 % |
| *C score is our assessment of a Stock's correlation to CAN SLIM principles. It combines a stock's Technical and Fundamental merits and is expressed as a percentage. | |||||
Breakdowns within 5% of Breakdown Price
| Watchlist | Symbol | Company | Industry | C Score* | % Loss |
|---|---|---|---|---|---|
| SS | SRPT | Sarepta Therapeutics, Inc. | Biotechnology | 58.6 % | -4 % |
| SS | TEVA | Teva Pharmaceutical Indus | Biotechnology | 51.7 % | -4.9 % |
| *C score is our assessment of a Stock's correlation to CAN SLIM principles. It combines a stock's Technical and Fundamental merits and is expressed as a percentage. | |||||
Cup and Handle Stocks Likely to Breakout next Week
| Symbol | BoP | Company | Industry | Relative Strength Rank | Within x% of BoP | C Score* |
|---|---|---|---|---|---|---|
| VKTX | 81.73 | Viking Therapeutics, Inc. | Biotechnology | 97.00 | 83.79 | 38.1 |
| SPRY | 17.08 | ARS Pharmaceuticals, Inc. | Biotechnology | 97.00 | 99.77 | 41.3 |
| DCTH | 70.4 | |||||
| APGE | 39.5 | |||||
| COGT | 34.7 | |||||
| VERA | 39.1 | |||||
| BV | 40 | |||||
| CLPR | 6.90 | Clipper Realty Inc. | Thermal Coal | 80.00 | 88.84 | 40.9 |
| AVAV | 71.1 | |||||
| CENX | 59.9 | |||||
| DESP | 15.68 | Despegar.com, Corp. Ordin | Textile Manufacturing | 90.00 | 95.66 | 40.1 |
| LNTH | 30.1 | |||||
| HIPO | 42 | |||||
| PM | 60.8 | |||||
| DDI | 39 | |||||
| UTHR | 74.9 | |||||
| VIST | 33.5 | |||||
| WIX | 179.00 | Wix.com Ltd. | Utilities - Regulated Gas | 80.00 | 96.37 | 36.6 |
| CINT | 35.4 | |||||
| OPY | 65.3 | |||||
| MASI | 59.7 | |||||
| AA | 38 | |||||
| KROS | 39.9 | |||||
| FTNT | 65.7 | |||||
| EBC | 36 | |||||
| SHOP | 35.9 | |||||
| RBB | 36.2 | |||||
| SQ | 35.4 | |||||
| SRAD | 39.9 | |||||
| TSLA | 39.7 | |||||
| ITRI | 68.8 | |||||
| *C score is our assessment of a Stock's correlation to CAN SLIM principles. It combines a stock's Technical and Fundamental merits and is expressed as a percentage. | ||||||
Cup and Handle Chart of the Week
There were no cup and handle stocks meeting our breakout model criteria this week.